Moon Temp Sensor Offset Analysis

Moon Temp — Sensor Offset Analysis

Outdoor thermistor array for moon observation sessions. Three MF58 10 kΩ NTC sensors read simultaneously by an ADS1115 ADC on an ESP32-C3. Device publishes raw 16-bit ADC counts over MQTT and logs to daily CSVs on NAS (/mnt/nas/rooster/moon-temp-logs/).

Hardware: 3× NTC on ADS1115 (channels 0–2) / ESP32-C3
ADC LSB: 0.13108 mV/count (calibrated; nominal 0.125 mV)
Current offsets (ESP32-C3 flash): ADC0 = 0 · ADC1 = +22 · ADC2 = −64

Log Eras

Period Path VCC v_rail column
May–Jun 2026 logs_2.3V/logs/ 2.3 V (hardware fault) absent
Jul 2026+ raw_logs/ ~3.3 V measured per-row present

Converted temperature CSVs (pre-computed °C) live in converted_logs/.

Code
%matplotlib inline
import os, platform
import pandas as pd
import numpy as np
import matplotlib.pyplot as plt
import matplotlib.dates as mdates

NAS_BASE = (
    "/Volumes/AlphaDoom_6/rooster/moon-temp-logs"
    if platform.system() == 'Darwin'
    else "/mnt/nas/rooster/moon-temp-logs"
)

plt.rcParams['figure.figsize'] = (14, 4)
plt.rcParams['figure.dpi'] = 110

Offset Methodology

Calibration aligns three channels against ADC0 (reference, offset always 0).

Step 1 — Burst alignment

  1. Start the logger at a 5-second interval: moon_temp_logger --interval 5
  2. Manually send offset commands to ADC1 and ADC2 until all three channels match ADC0. Example: mosquitto_pub -h 10.0.0.50 -t moon-temp-001/offset/cmd -m '{"adc":1,"offset":16}'
  3. Stop the 5s logger

Step 2 — Overnight verification

  1. Start systemd logger: sudo systemctl start moon_temp_logger
  2. Run overnight (≥ 8 h) to capture the full thermal range
  3. Run the Running Calibration Confirmation section at the bottom to check alignment

Heat Response Test

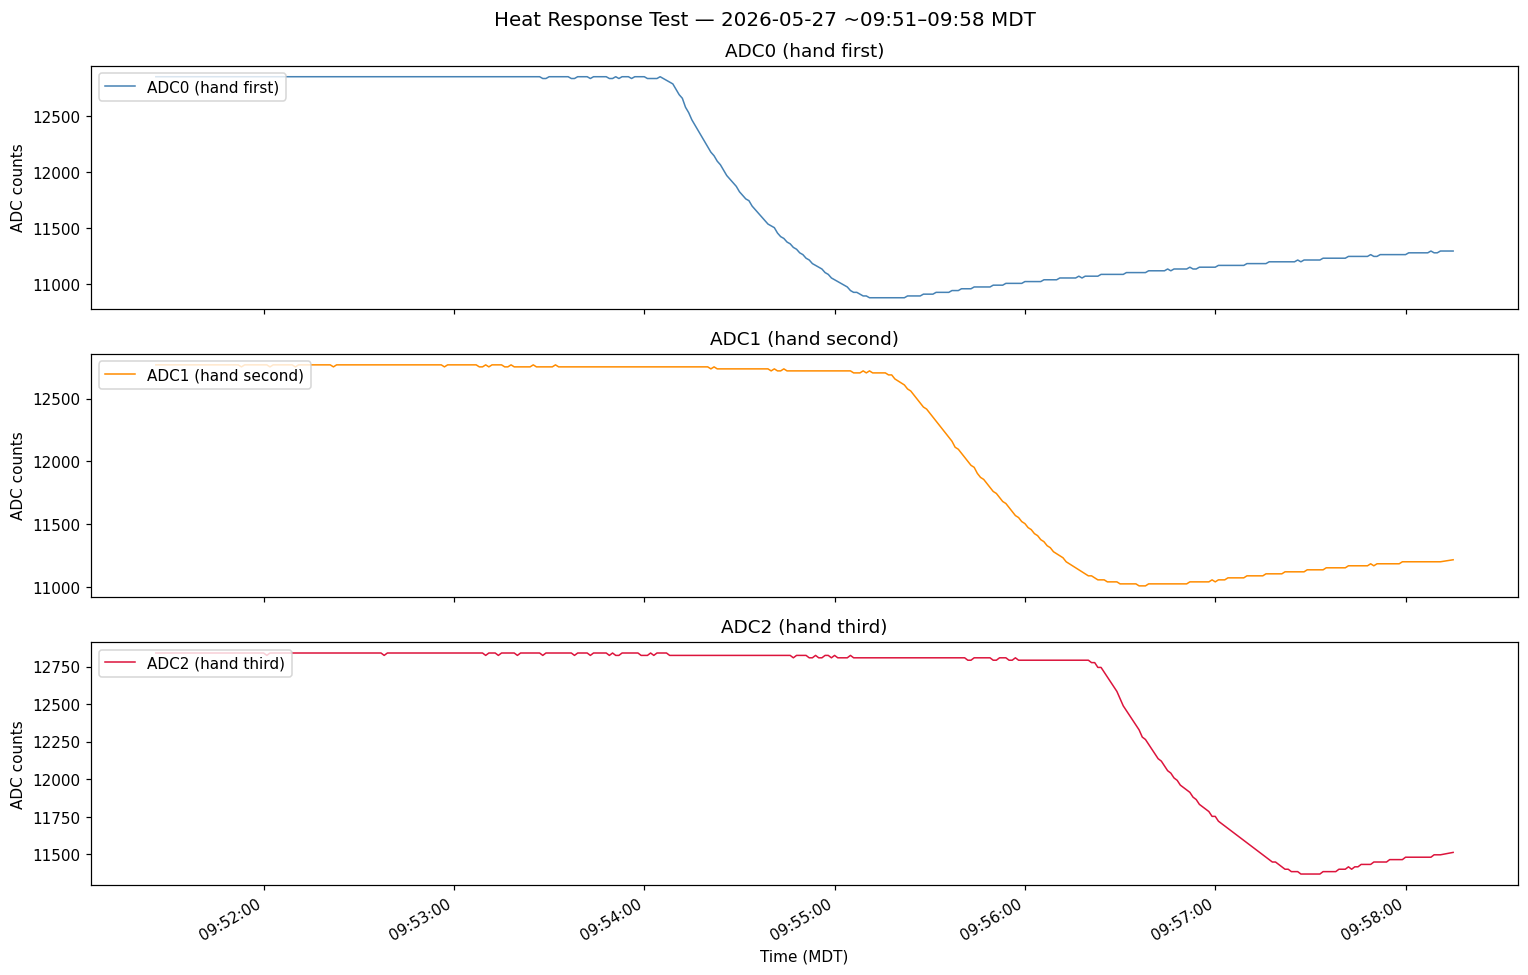
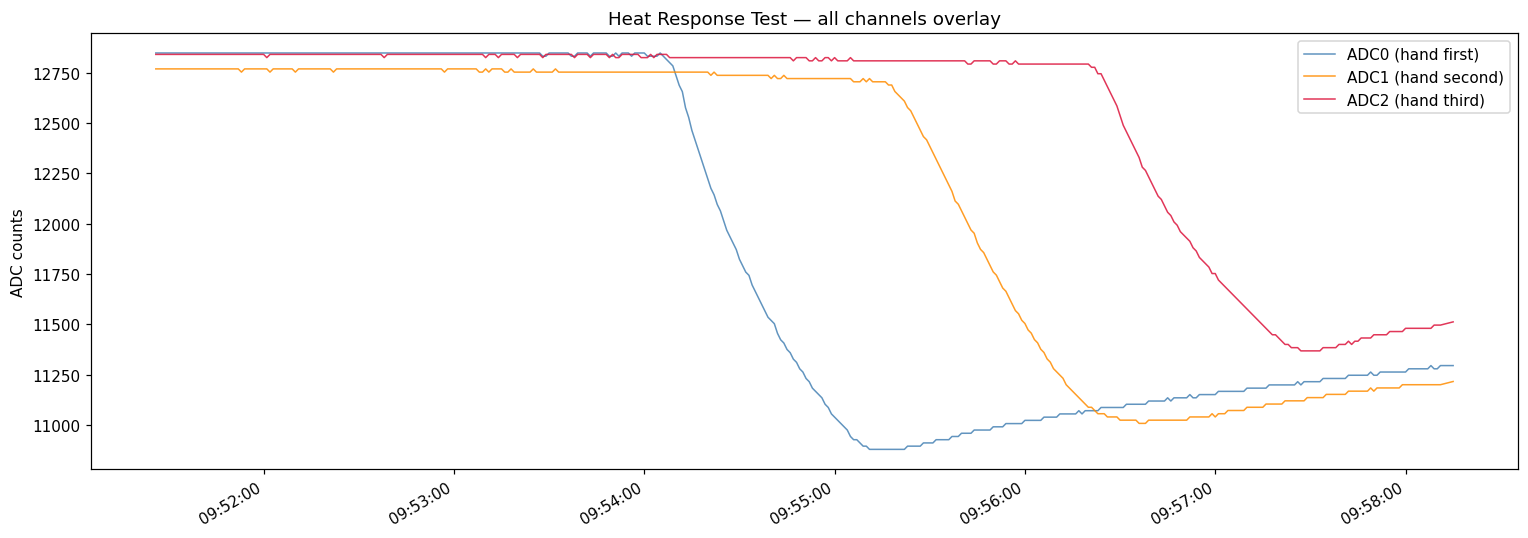
Sensor liveness check: manual heat applied to each thermistor in sequence. Window: 2026-05-27, 09:51–09:58 MDT (~7 minutes) Interval: 1-second sampling Sequence: ADC0 → ADC1 → ADC2, ~1 minute each Response: NTC thermistors decrease resistance when heated → lower ADC counts

Code
TEST_START = '2026-05-27 09:51:00'
TEST_END   = '2026-05-27 09:59:00'

df_full = pd.read_csv(
    os.path.join(NAS_BASE, "logs_2.3V/logs/2026-05-27.csv"),
    parse_dates=['timestamp']
)
df_full = df_full.sort_values('timestamp').reset_index(drop=True)

test = df_full[(df_full['timestamp'] >= TEST_START) & (df_full['timestamp'] <= TEST_END)].copy()

print(f"Rows : {len(test)}")
print(f"Span : {test['timestamp'].iloc[0]}{test['timestamp'].iloc[-1]}")
print(f"Sample interval (median): {test['timestamp'].diff().dt.total_seconds().median():.0f}s")
print()
for col in ['adc0','adc1','adc2']:
    d = test[col]
    print(f"{col}: min={d.min()}  max={d.max()}  mean={d.mean():.1f}  std={d.std():.1f}")
Rows : 385
Span : 2026-05-27 09:51:26  →  2026-05-27 09:58:15
Sample interval (median): 1s

adc0: min=10880  max=12848  mean=11826.8  std=831.8
adc1: min=11009  max=12769  mean=12122.6  std=757.5
adc2: min=11369  max=12841  mean=12509.9  std=543.2
Code
# Per-channel subplots
fig, axes = plt.subplots(3, 1, figsize=(14, 9), sharex=True)
colors = {'adc0': 'steelblue', 'adc1': 'darkorange', 'adc2': 'crimson'}
labels = {'adc0': 'ADC0 (hand first)', 'adc1': 'ADC1 (hand second)', 'adc2': 'ADC2 (hand third)'}

for ax, col in zip(axes, ['adc0', 'adc1', 'adc2']):
    ax.plot(test['timestamp'], test[col], color=colors[col], linewidth=1.0, label=labels[col])
    ax.xaxis.set_major_formatter(mdates.DateFormatter('%H:%M:%S'))
    ax.set_ylabel('ADC counts')
    ax.legend(loc='upper left')
    ax.set_title(labels[col])

axes[-1].set_xlabel('Time (MDT)')
fig.suptitle('Heat Response Test — 2026-05-27 ~09:51–09:58 MDT', fontsize=13)
fig.autofmt_xdate()
plt.tight_layout()
plt.show()

Code
# Overlay — sequential drops clearly visible
fig, ax = plt.subplots(figsize=(14, 5))
for col in ['adc0', 'adc1', 'adc2']:
    ax.plot(test['timestamp'], test[col], color=colors[col], linewidth=1.0, label=labels[col], alpha=0.85)
ax.xaxis.set_major_formatter(mdates.DateFormatter('%H:%M:%S'))
ax.set_ylabel('ADC counts')
ax.set_title('Heat Response Test — all channels overlay')
ax.legend()
fig.autofmt_xdate()
plt.tight_layout()
plt.show()


Hardware Reference

Sensors: 3× MF58 10 kΩ NTC, B = 3950 K, R₀ = 10 kΩ @ 25 °C
Series resistor: 10 kΩ fixed
ADC: ADS1115 (I²C 0x48), PGA ±4.096 V, 16-bit
ADC LSB (calibrated): 0.13108 mV/count (nominal 0.125 mV — ~4.9 % reference offset measured against multimeter)
Firmware: ESP32-C3, Embassy async, MQTT 3.1.1

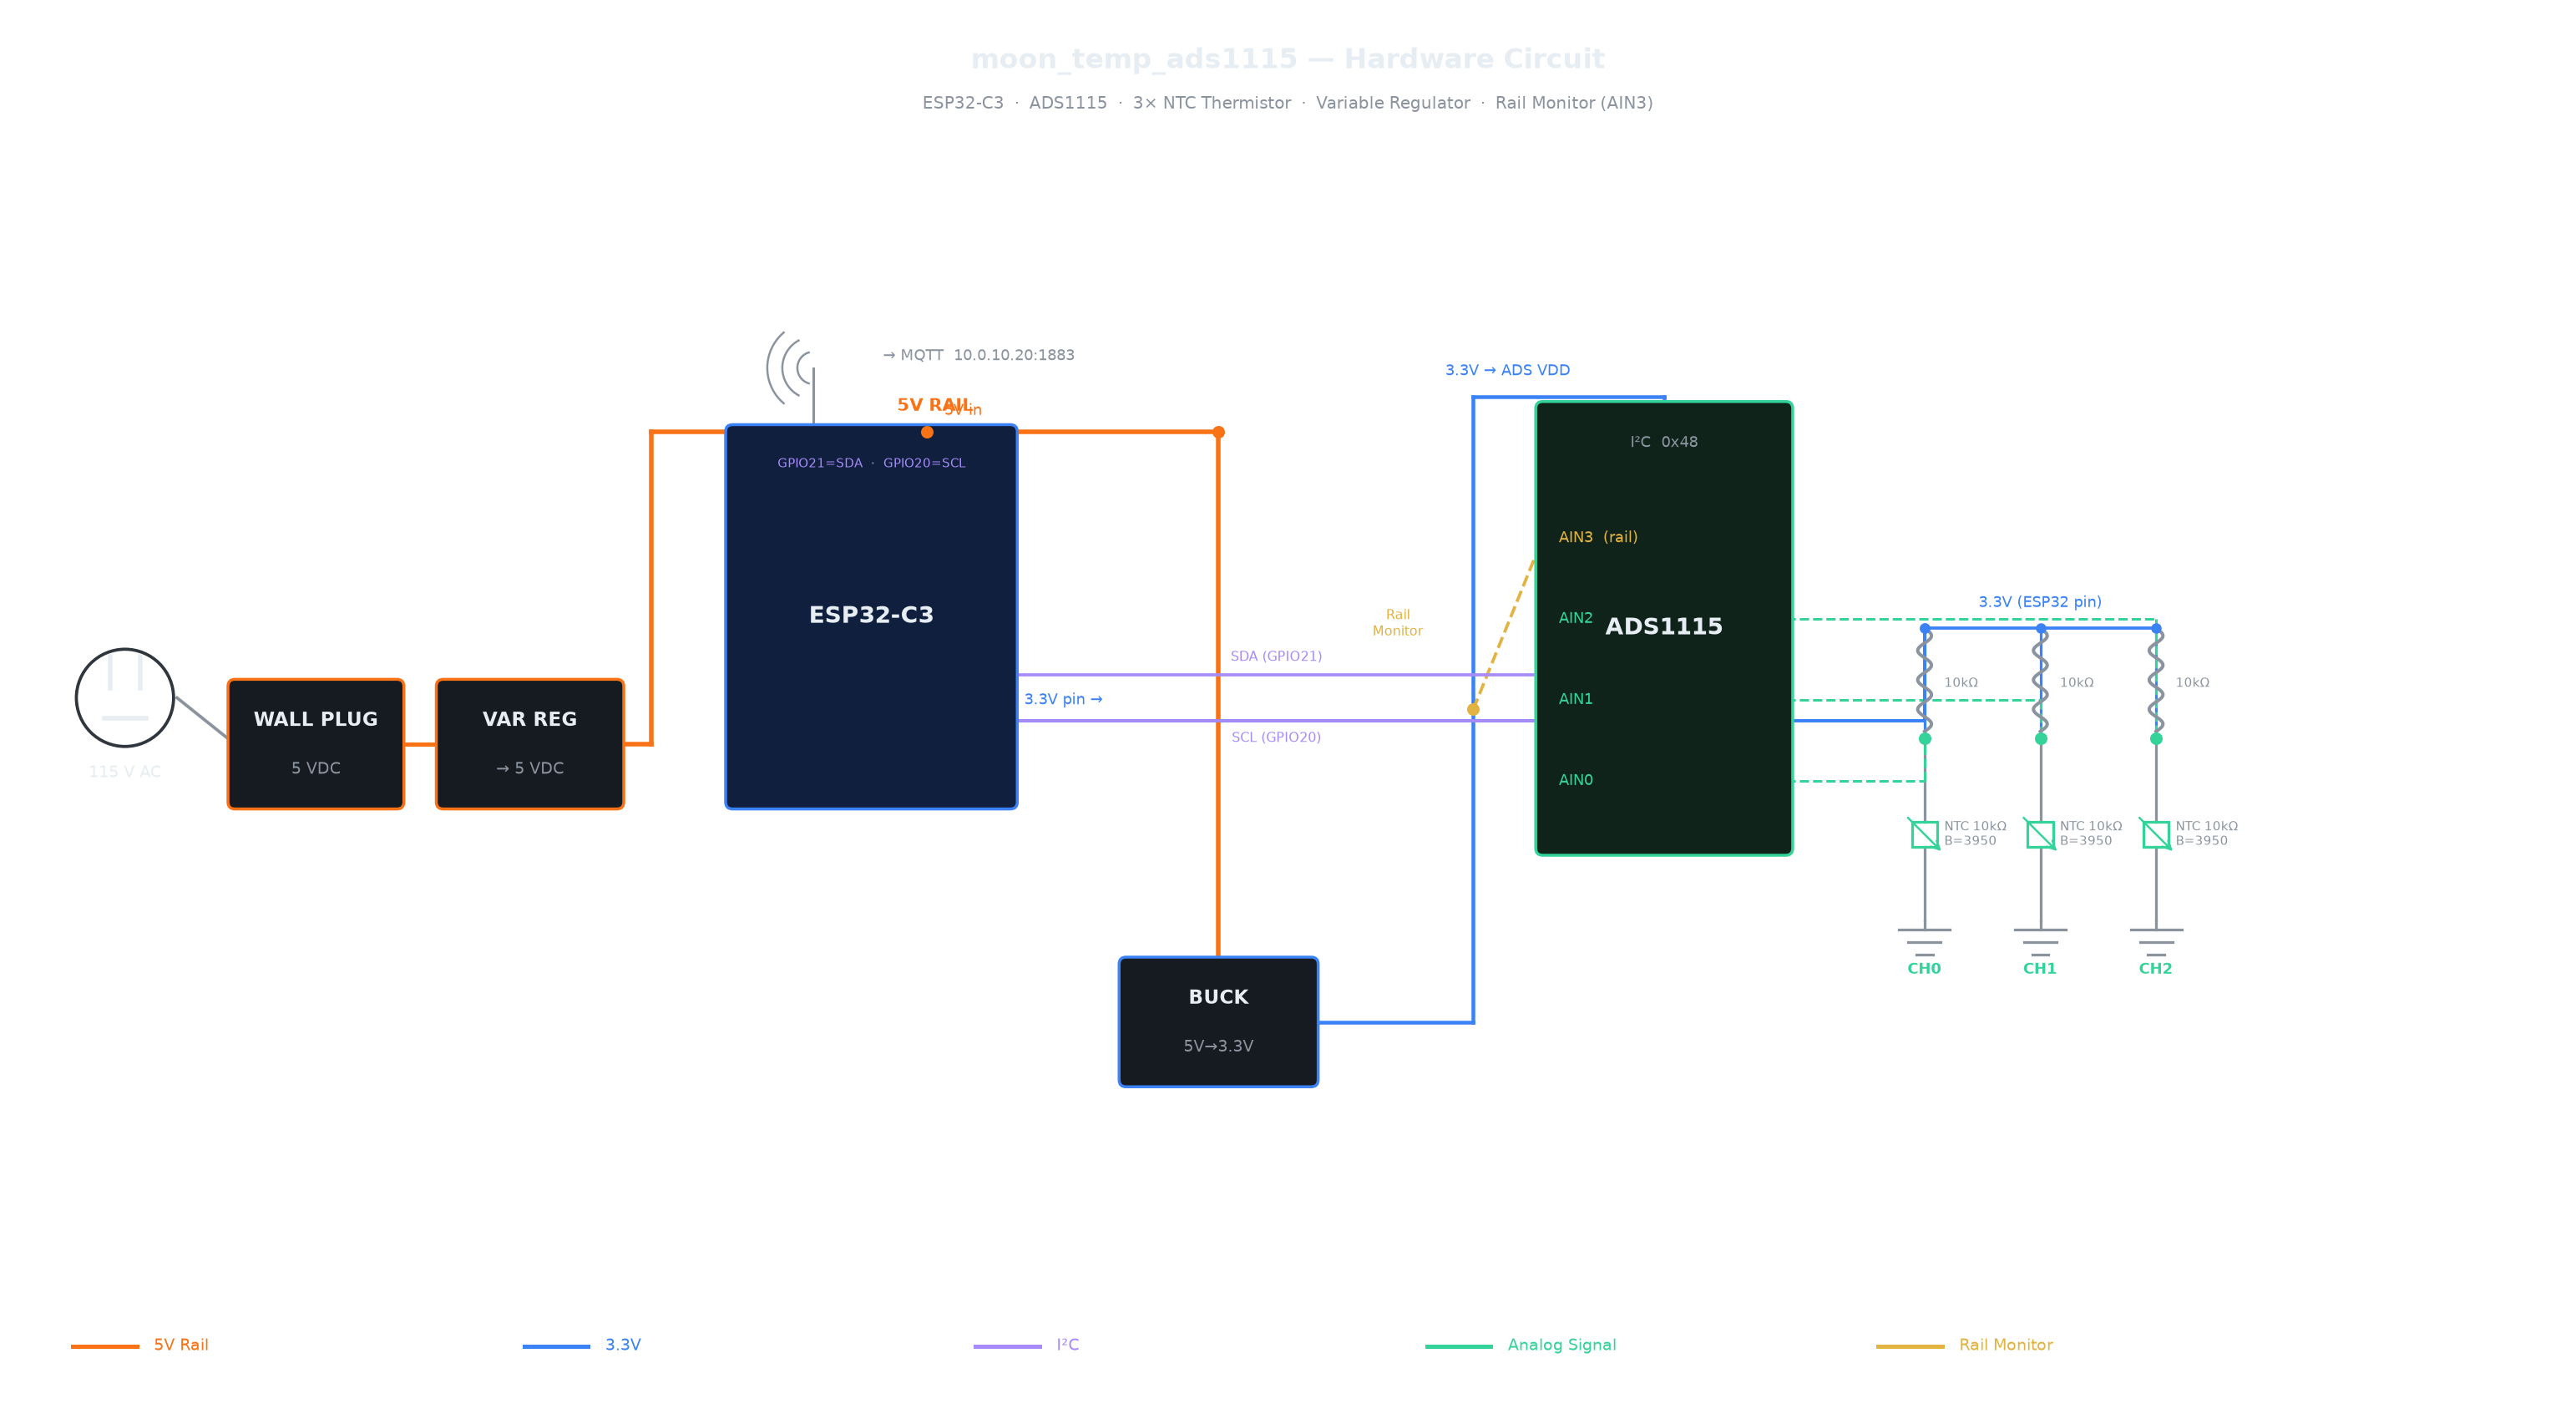
Power Chain (updated July 2026)

Stage Detail
Mains 115 V AC → 5 VDC wall adapter
Variable regulator Adjustable → 5 V rail
ESP32-C3 Powered directly from 5 V rail; 3.3 V pin supplies thermistor VCC
Buck converter 5 V → 3.3 V dedicated supply for ADS1115 VDD
Rail monitor ADS1115 AIN3 wired to ADS VDD (3.3 V from buck) — logged as v_rail

Circuit Diagram

moon_temp_ads1115 hardware circuit diagram

Thermistor Circuit (per channel)

3.3 V (ESP32 pin) → 10 kΩ → ADS1115 AINx → NTC 10 kΩ (B=3950) → GND

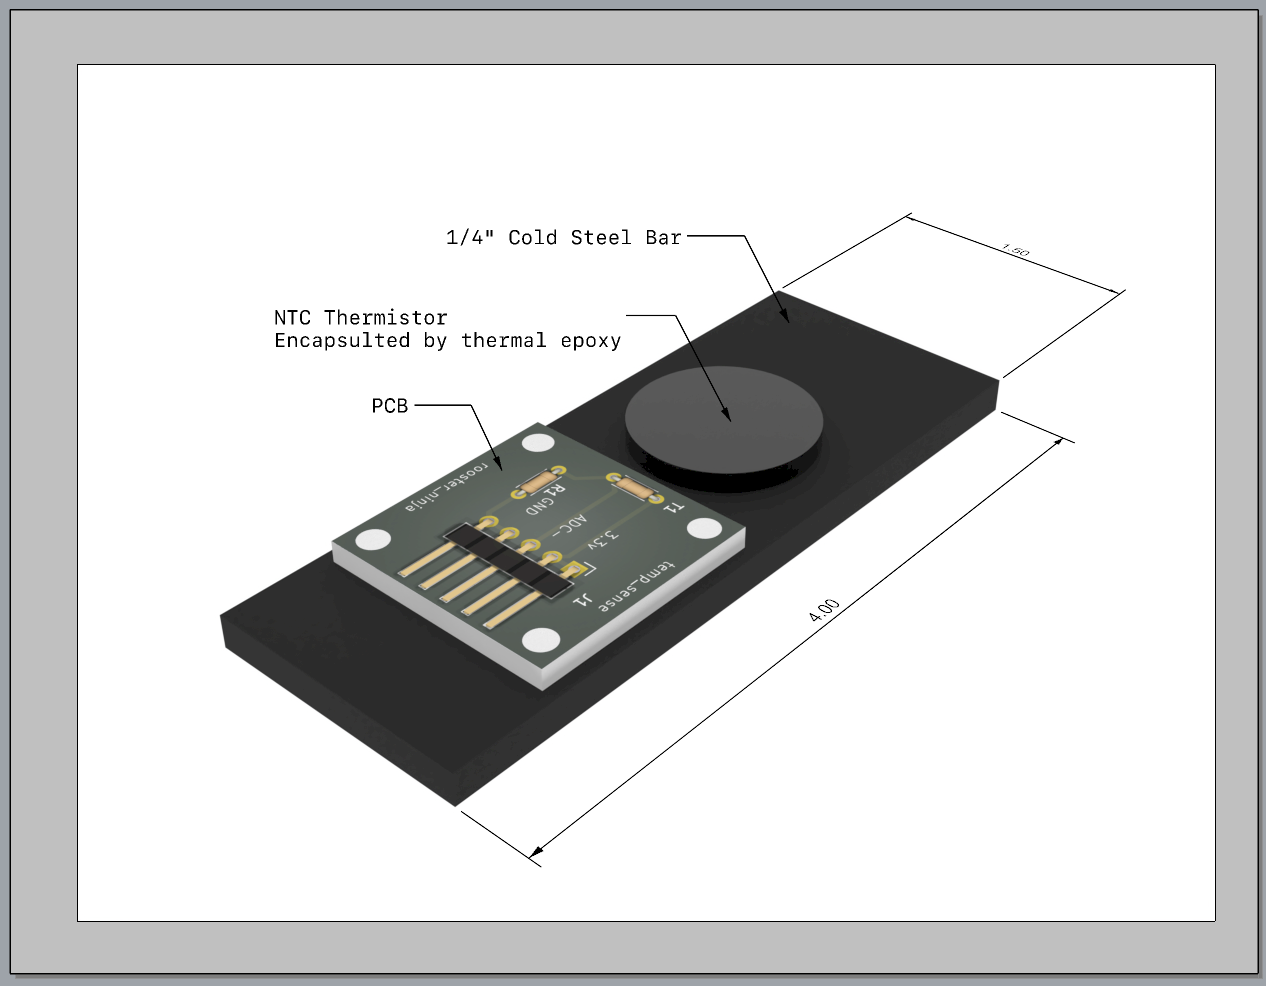
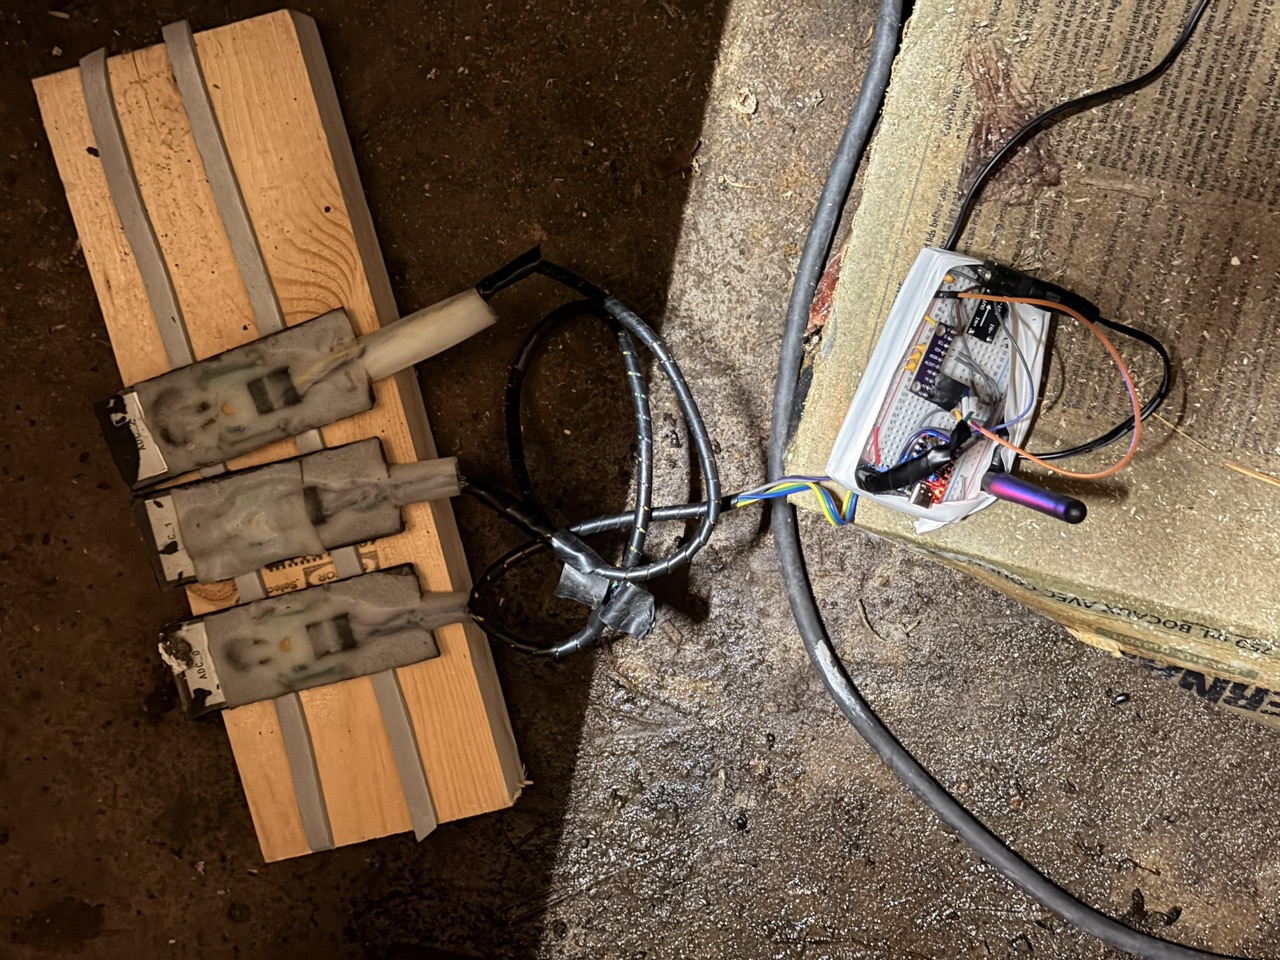
Sensor construction — NTC thermistor thermal-epoxied to 4″×1.5″×¼″ cold steel bar

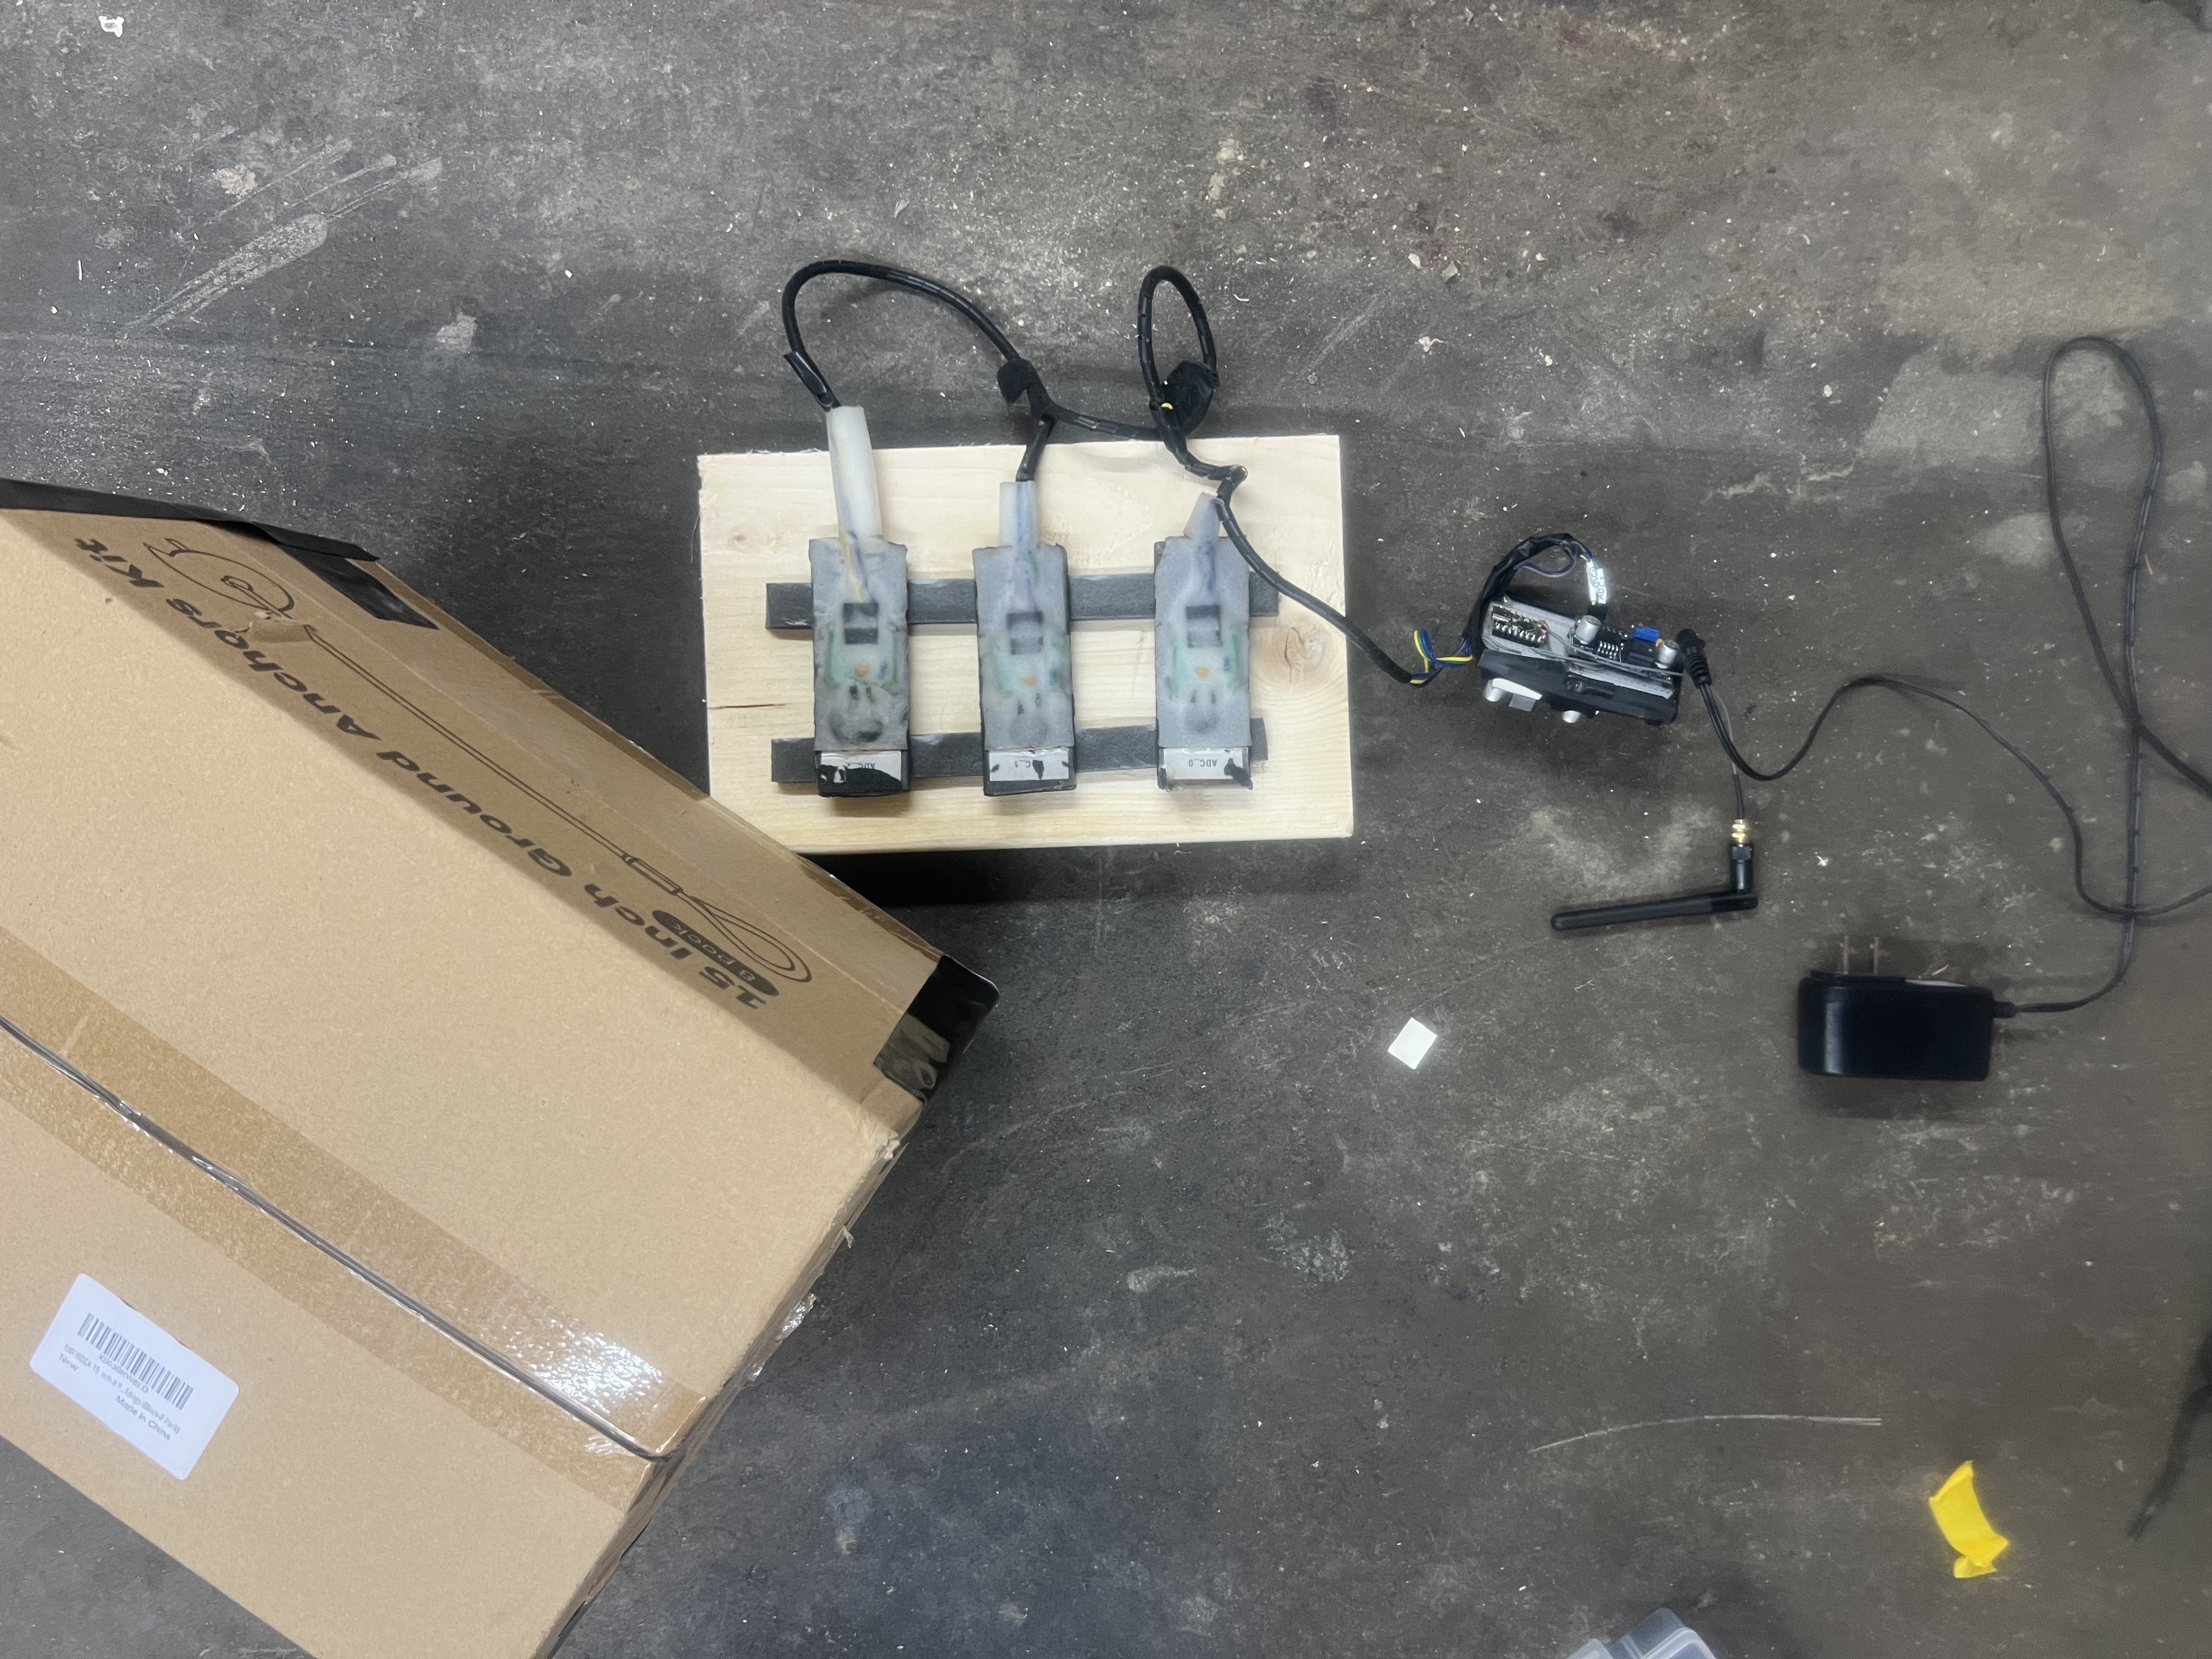
Hardware Photos

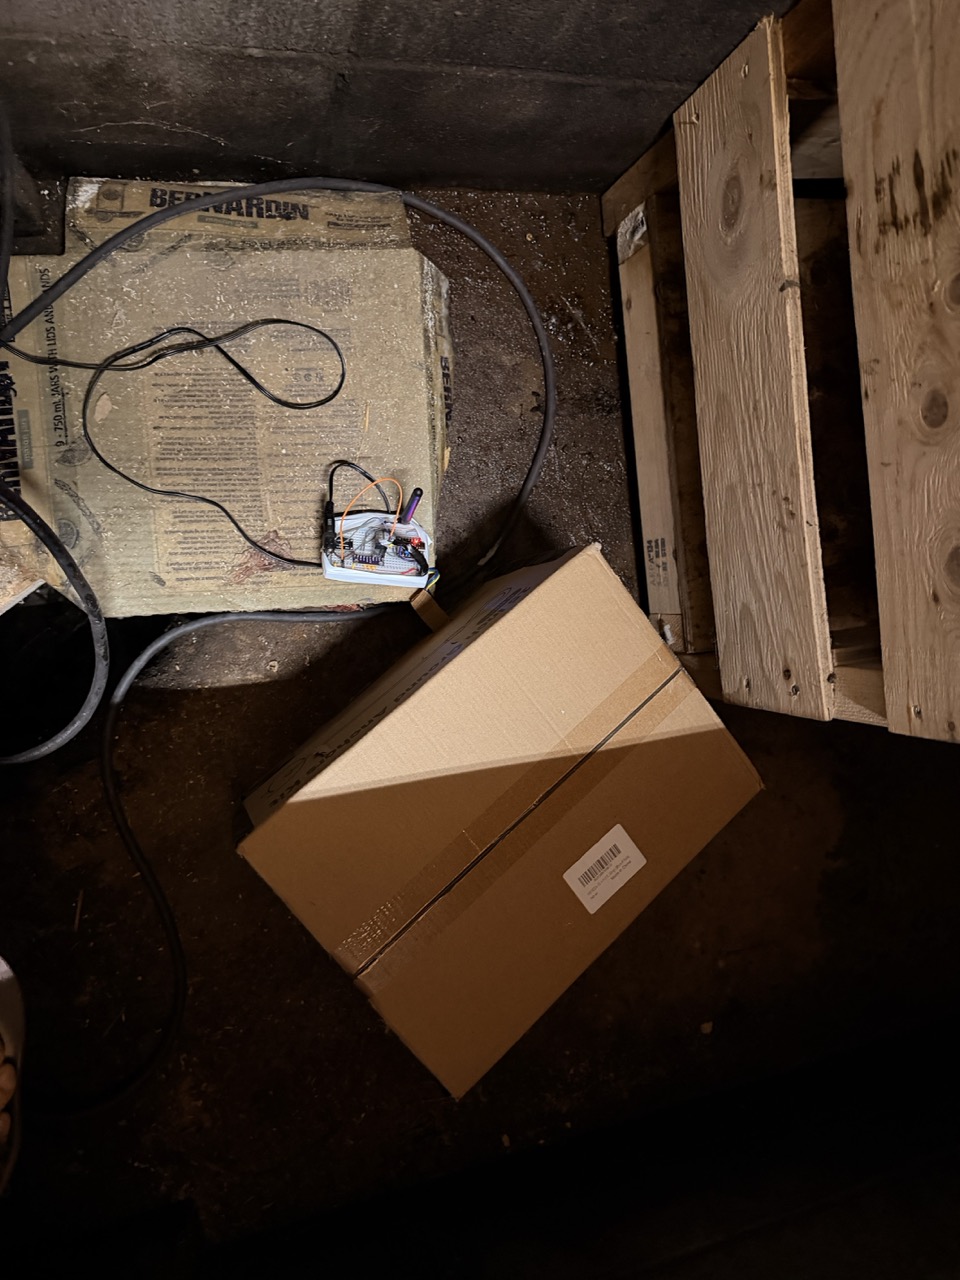
Sensors, ESP32-C3, and power supply — bench setup

Three NTC sensor assemblies on wooden mount, ESP32-C3 with antenna, and USB power supply


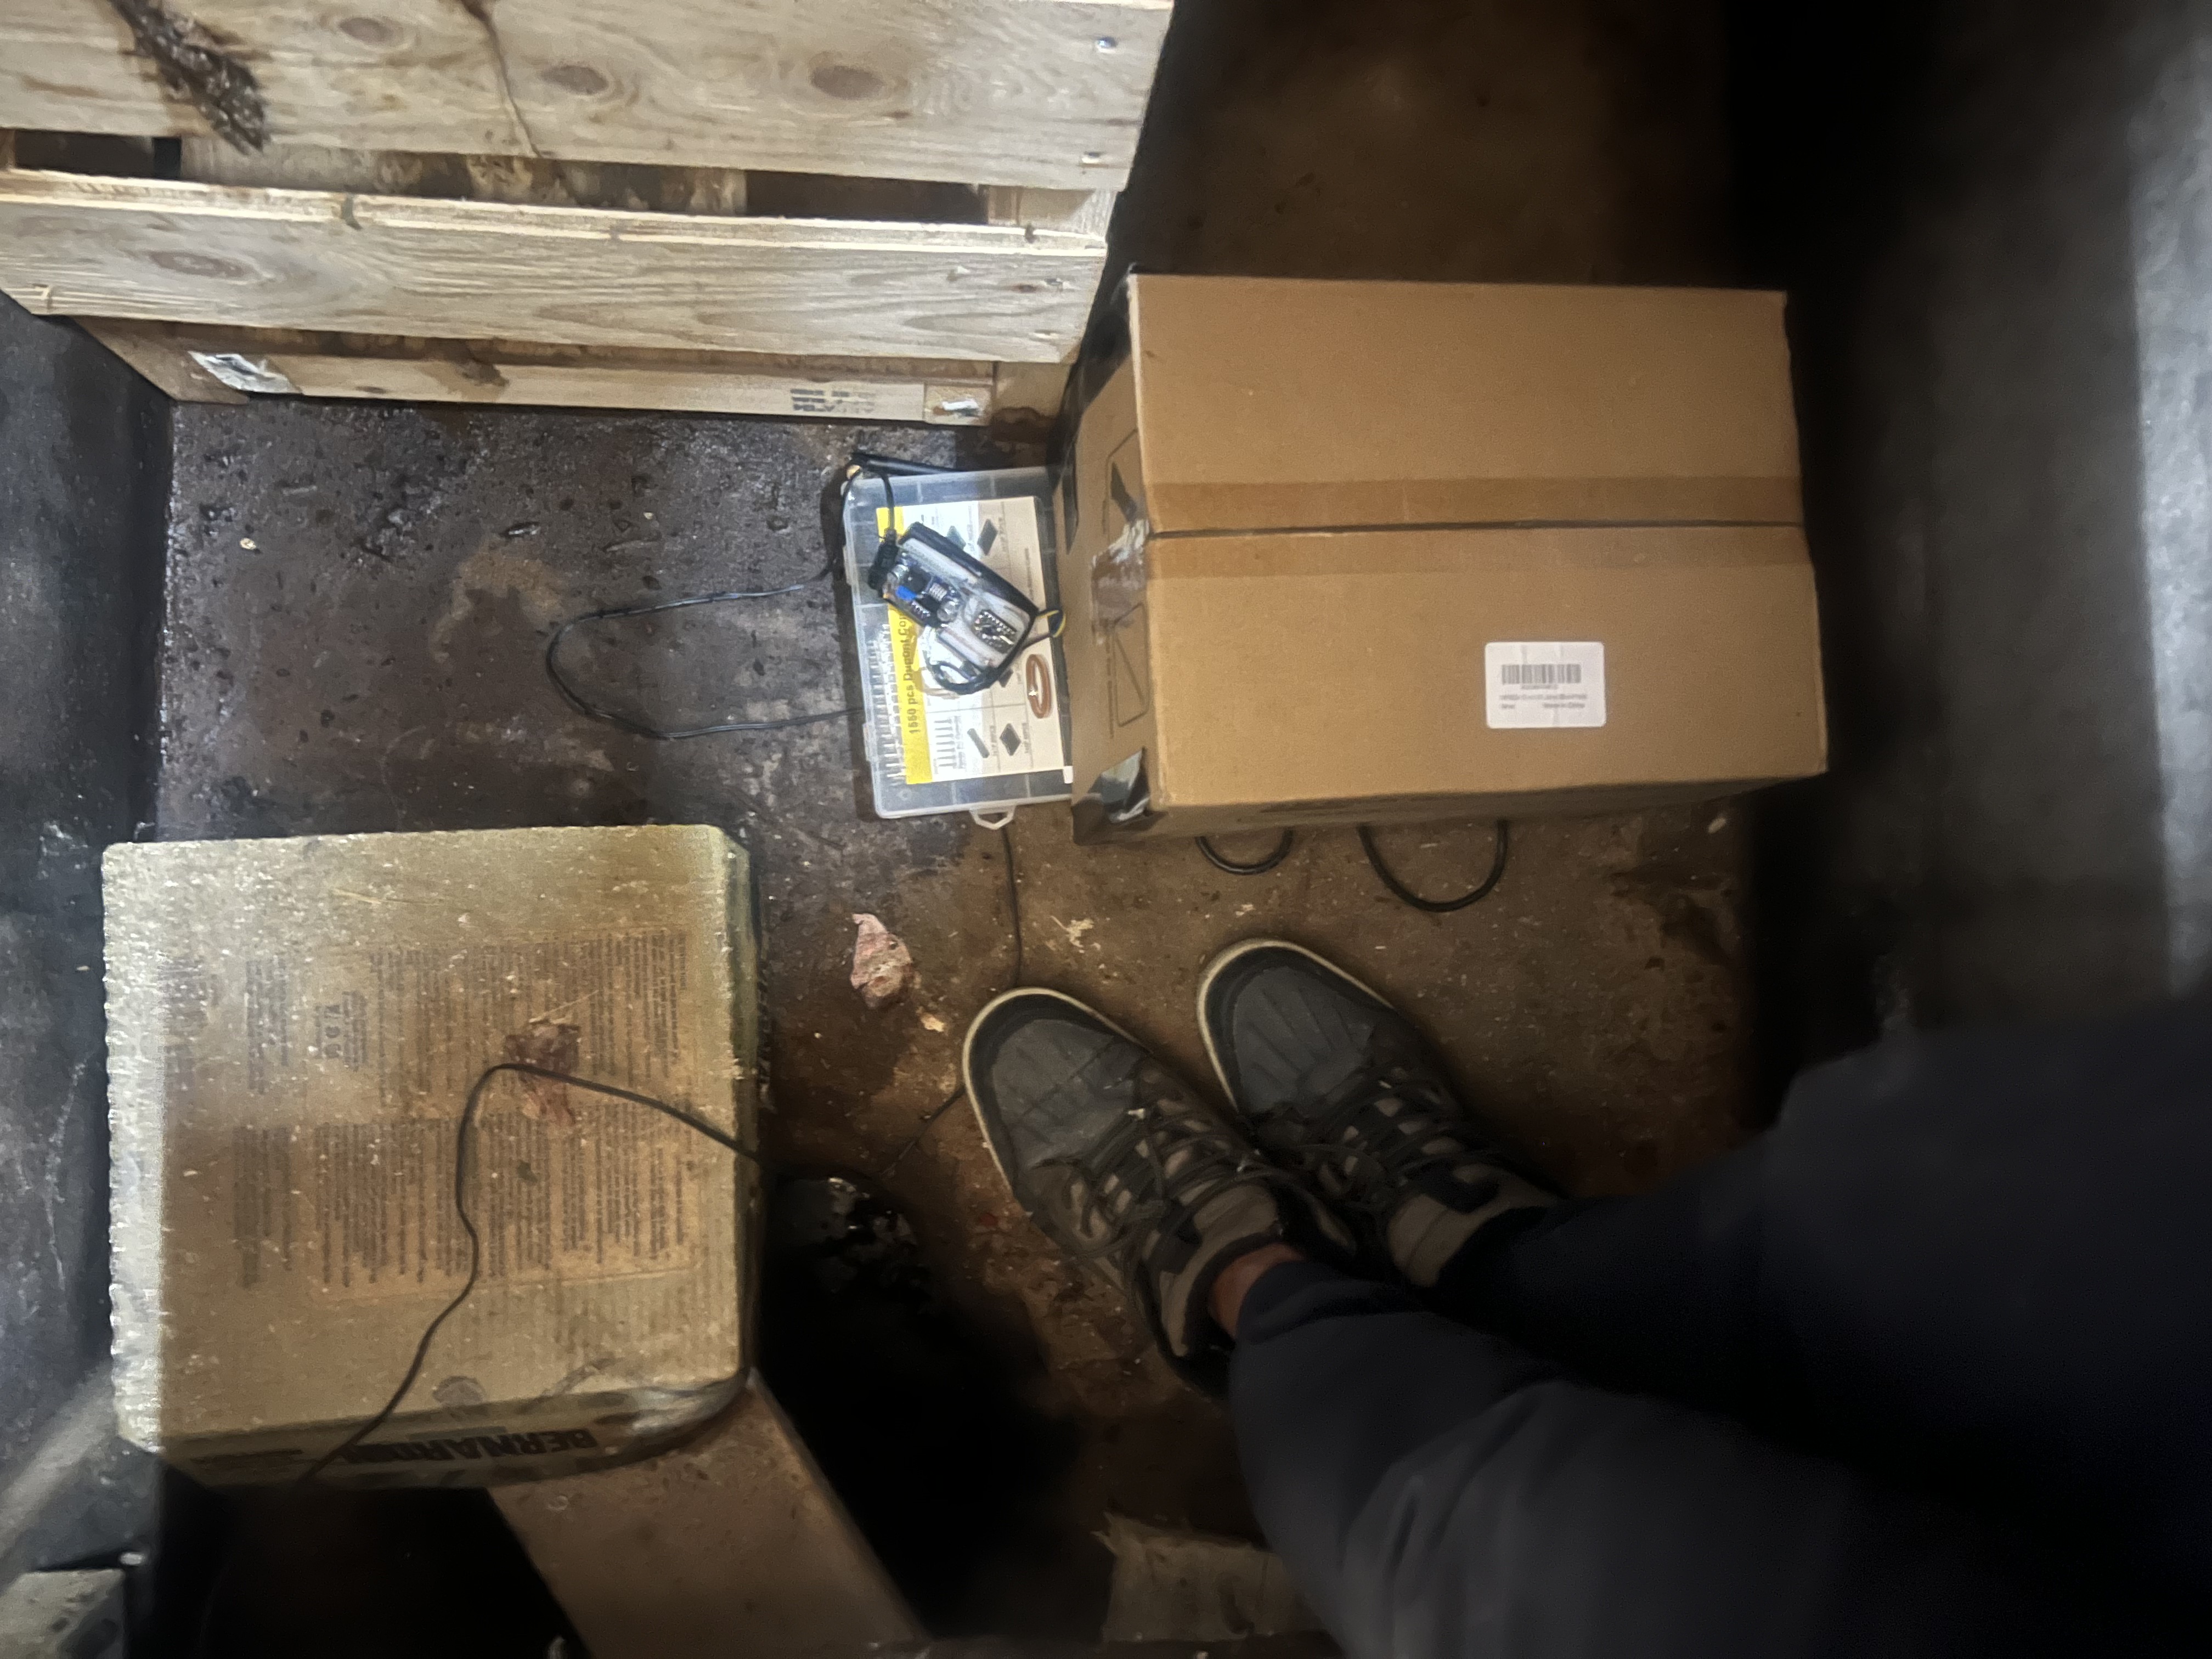
Static chamber — 8 ft deep concrete pit (looking down)

8-foot deep concrete block pit used as static thermal chamber


Inside the pit — sensor deployment at depth

Bottom of pit showing steel bar sensor assemblies and ESP32 electronics enclosure deployed in-situ


Pit entrance — July 2026 hardware update

Pit entrance showing updated hardware installation


Updated rig — variable regulator and buck converter installed

Updated sensor rig with variable regulator and ADS1115 dedicated buck converter

Running Calibration Confirmation

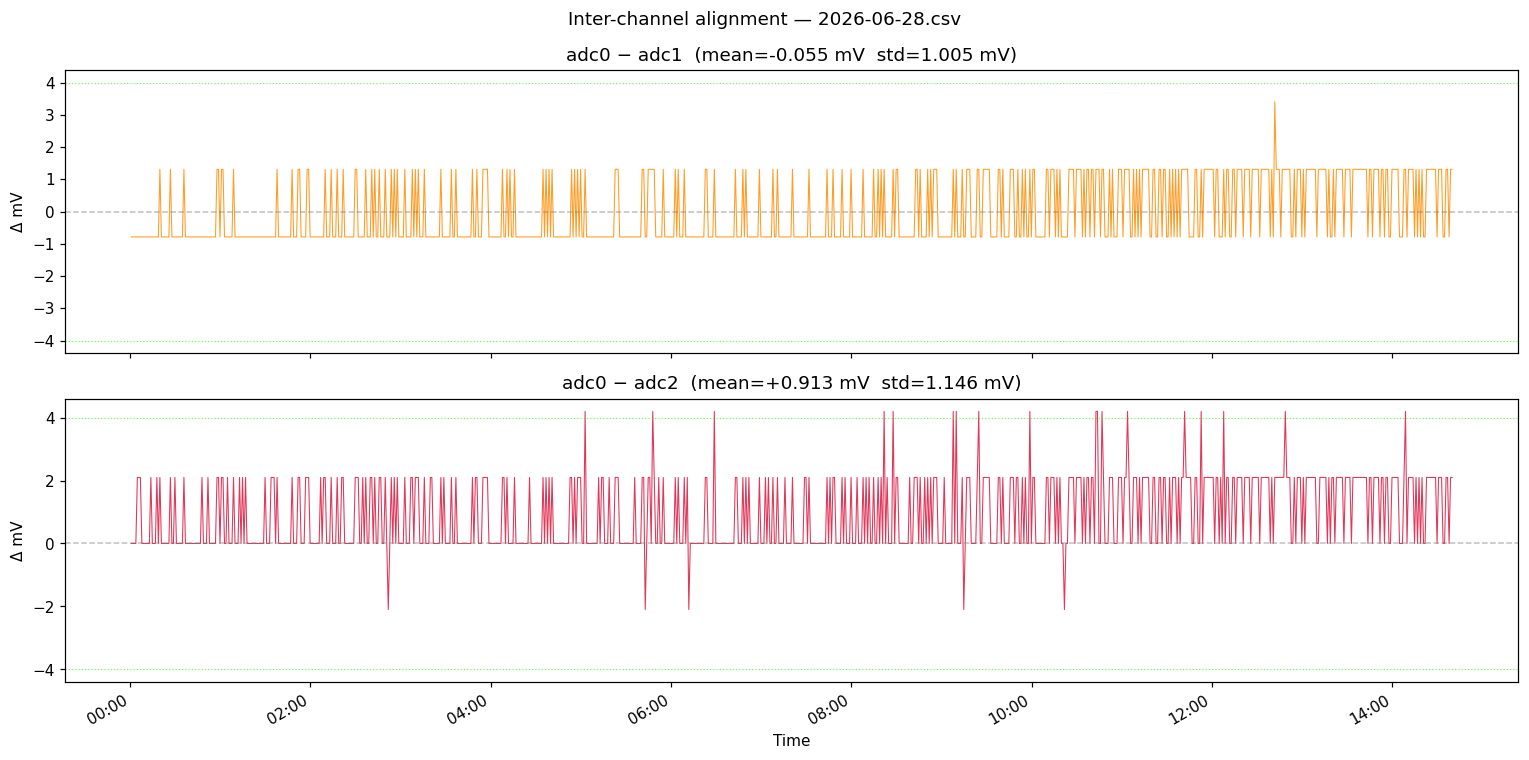
Auto-loads the most recent log CSV and evaluates inter-channel alignment. Run after any overnight session or after applying new offsets.

Pass criterion: std(adc0 − adc1) ≤ 5 counts AND std(adc0 − adc2) ≤ 5 counts (5 counts = 0.625 mV ≈ 10–15 m°C at pit temperatures)

Code
import glob

LOGS_2_3V = os.path.join(NAS_BASE, "logs_2.3V/logs")   # VCC=2.3V era, no v_rail
LOGS_NEW   = os.path.join(NAS_BASE, "raw_logs")          # Jul 2026+, v_rail present
LOGS_CONV  = os.path.join(NAS_BASE, "converted_logs")    # pre-computed °C

LOGS_DIR = LOGS_2_3V  # calibration analysis uses historical data

ADC_LSB  = 0.00013108     # V/count — calibrated against multimeter (nominal 0.000125)
ADC_MV   = ADC_LSB * 1000 # mV/count
PASS_STD_THRESHOLD = 4.0  # mV

print(f"NAS base : {NAS_BASE}")

csv_files = [f for f in sorted(glob.glob(os.path.join(LOGS_DIR, "????-??-??.csv")))
             if os.path.basename(f) <= "2026-06-28.csv"]
if not csv_files:
    raise FileNotFoundError(f"No dated CSV files found in {LOGS_DIR}")

latest_csv = csv_files[-1]
df_cal = pd.read_csv(latest_csv, parse_dates=['timestamp'])
df_cal = df_cal.sort_values('timestamp').reset_index(drop=True)

cal_diff01 = (df_cal['adc0'] - df_cal['adc1']) * ADC_MV
cal_diff02 = (df_cal['adc0'] - df_cal['adc2']) * ADC_MV

print(f"File     : {latest_csv}")
print(f"Rows     : {len(df_cal)}")
print(f"Span     : {df_cal['timestamp'].iloc[0]}{df_cal['timestamp'].iloc[-1]}")
print(f"v_rail   : {'present' if 'v_rail' in df_cal.columns else 'absent (2.3 V era)'}")
print()
print(f"adc0 − adc1 : mean={cal_diff01.mean():+.3f} mV  std={cal_diff01.std():.3f} mV")
print(f"adc0 − adc2 : mean={cal_diff02.mean():+.3f} mV  std={cal_diff02.std():.3f} mV")
NAS base : /mnt/nas/rooster/moon-temp-logs
File     : /mnt/nas/rooster/moon-temp-logs/logs_2.3V/logs/2026-06-28.csv
Rows     : 880
Span     : 2026-06-28 00:00:54  →  2026-06-28 14:39:54
v_rail   : absent (2.3 V era)

adc0 − adc1 : mean=-0.055 mV  std=1.005 mV
adc0 − adc2 : mean=+0.913 mV  std=1.146 mV
Code
fig, axes = plt.subplots(2, 1, figsize=(14, 7), sharex=True)

for ax, diff, label, color in [
    (axes[0], cal_diff01, 'adc0 − adc1', 'darkorange'),
    (axes[1], cal_diff02, 'adc0 − adc2', 'crimson'),
]:
    ax.plot(df_cal['timestamp'], diff, color=color, linewidth=0.7, alpha=0.85)
    ax.axhline(0, color='gray', linestyle='--', linewidth=1.0, alpha=0.5)
    ax.axhline( PASS_STD_THRESHOLD, color='lime', linestyle=':', linewidth=0.8, alpha=0.6)
    ax.axhline(-PASS_STD_THRESHOLD, color='lime', linestyle=':', linewidth=0.8, alpha=0.6)
    ax.xaxis.set_major_formatter(mdates.DateFormatter('%H:%M'))
    ax.set_title(f'{label}  (mean={diff.mean():+.3f} mV  std={diff.std():.3f} mV)')
    ax.set_ylabel('Δ mV')

axes[-1].set_xlabel('Time')
fig.suptitle(f'Inter-channel alignment — {os.path.basename(latest_csv)}', fontsize=12)
fig.autofmt_xdate()
plt.tight_layout()
plt.show()

Code
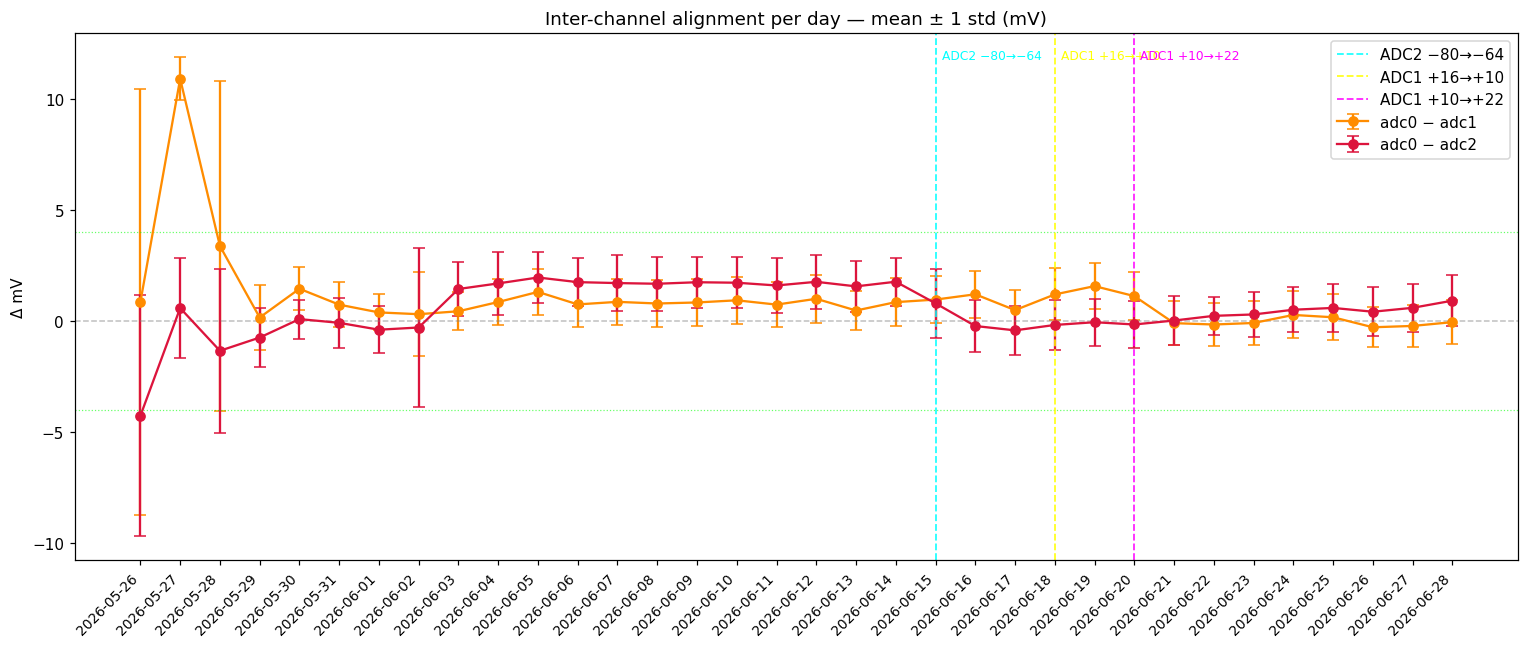
# Calibration history — mean inter-channel difference per day (± 1 std, mV)
all_csvs = [f for f in sorted(glob.glob(os.path.join(LOGS_DIR, "????-??-??.csv")))
             if "2026-05-26.csv" <= os.path.basename(f) <= "2026-06-28.csv"]

rows = []
for path in all_csvs:
    d = pd.read_csv(path, parse_dates=['timestamp'])
    d = d.sort_values('timestamp').reset_index(drop=True)
    label = os.path.basename(path).replace('.csv', '')

    if '2026-05-27' in label:
        d = d[~((d['timestamp'] >= '2026-05-27 09:51:00') & (d['timestamp'] <= '2026-05-27 09:58:15'))]

    diff01 = (d['adc0'] - d['adc1']) * ADC_MV
    diff02 = (d['adc0'] - d['adc2']) * ADC_MV

    rows.append({
        'day':      label,
        'd01_mean': diff01.mean(),
        'd02_mean': diff02.mean(),
        'd01_std':  diff01.std(),
        'd02_std':  diff02.std(),
    })

hist = pd.DataFrame(rows).set_index('day')
print("Inter-channel alignment history (mV, heat test excluded from May 27)")
print()
print(hist.round(3).to_string())

fig, ax = plt.subplots(figsize=(14, 6))
x = range(len(rows))
for col, color, lbl in [
    ('d01_mean', 'darkorange', 'adc0 − adc1'),
    ('d02_mean', 'crimson',    'adc0 − adc2'),
]:
    means = hist[col].values
    stds  = hist[col.replace('mean', 'std')].values
    ax.errorbar(x, means, yerr=stds, fmt='o-', color=color, label=lbl,
                capsize=4, linewidth=1.5)

ax.axhline(0, color='gray', linestyle='--', linewidth=1, alpha=0.5)
ax.axhline( PASS_STD_THRESHOLD, color='lime', linestyle=':', linewidth=0.8, alpha=0.6)
ax.axhline(-PASS_STD_THRESHOLD, color='lime', linestyle=':', linewidth=0.8, alpha=0.6)

# Offset adjustment markers
adj_markers = [
    ('2026-06-15', 'cyan',    'ADC2 −80→−64'),
    ('2026-06-18', 'yellow',  'ADC1 +16→+10'),
    ('2026-06-20', 'magenta', 'ADC1 +10→+22'),
]
idx_list = list(hist.index)
for day, color, lbl in adj_markers:
    if day in idx_list:
        xi = idx_list.index(day)
        ax.axvline(xi, color=color, linestyle='--', linewidth=1.2, alpha=0.85, label=lbl)
        ax.text(xi + 0.15, 0.97, lbl, transform=ax.get_xaxis_transform(),
                color=color, fontsize=8, va='top', ha='left')

ax.set_xticks(list(x))
ax.set_xticklabels(hist.index, fontsize=9, rotation=45, ha='right')
ax.set_ylabel('Δ mV')
ax.set_title('Inter-channel alignment per day — mean ± 1 std (mV)')
ax.legend()
plt.tight_layout()
plt.show()
Inter-channel alignment history (mV, heat test excluded from May 27)

            d01_mean  d02_mean  d01_std  d02_std
day                                             
2026-05-26     0.854    -4.275    9.612    5.422
2026-05-27    10.913     0.580    0.977    2.248
2026-05-28     3.376    -1.346    7.446    3.690
2026-05-29     0.153    -0.750    1.474    1.327
2026-05-30     1.450     0.082    0.969    0.880
2026-05-31     0.733    -0.086    1.000    1.139
2026-06-01     0.383    -0.396    0.811    1.056
2026-06-02     0.303    -0.297    1.894    3.592
2026-06-03     0.435     1.439    0.855    1.219
2026-06-04     0.852     1.691    1.033    1.402
2026-06-05     1.308     1.957    1.029    1.148
2026-06-06     0.744     1.748    1.007    1.066
2026-06-07     0.859     1.705    1.035    1.279
2026-06-08     0.785     1.675    1.045    1.206
2026-06-09     0.832     1.743    1.070    1.154
2026-06-10     0.929     1.722    1.051    1.151
2026-06-11     0.736     1.598    1.004    1.248
2026-06-12     0.998     1.762    1.093    1.223
2026-06-13     0.469     1.557    0.881    1.162
2026-06-14     0.847     1.766    1.073    1.074
2026-06-15     0.961     0.792    1.048    1.543
2026-06-16     1.200    -0.230    1.050    1.181
2026-06-17     0.486    -0.425    0.889    1.115
2026-06-18     1.194    -0.182    1.174    1.133
2026-06-19     1.569    -0.058    1.035    1.056
2026-06-20     1.118    -0.160    1.075    1.054
2026-06-21    -0.100     0.017    1.006    1.114
2026-06-22    -0.162     0.229    0.963    0.867
2026-06-23    -0.093     0.291    0.993    1.005
2026-06-24     0.269     0.504    1.061    1.015
2026-06-25     0.165     0.585    1.044    1.077
2026-06-26    -0.286     0.414    0.911    1.101
2026-06-27    -0.226     0.590    0.928    1.083
2026-06-28    -0.055     0.913    1.005    1.146

Code
results = []
for label, diff in [('adc0 − adc1', cal_diff01), ('adc0 − adc2', cal_diff02)]:
    results.append((label, diff.mean(), diff.std(), diff.std() <= PASS_STD_THRESHOLD))

print("=" * 58)
print(f"  Calibration Confirmation — {os.path.basename(latest_csv)}")
print(f"  Pass threshold: std ≤ {PASS_STD_THRESHOLD} mV  (16 counts = 2 mV minimum step)")
print("=" * 58)
for label, mean_v, std_v, passed in results:
    print(f"  {label:14s}: mean={mean_v:+.3f} mV  std={std_v:.3f} mV  [{'PASS' if passed else 'FAIL'}]")
print("=" * 58)
if all(r[3] for r in results):
    print("  >> CALIBRATION OK")
else:
    print("  >> ADC offset may need adjustment — use burst alignment (Step 1)")
==========================================================
  Calibration Confirmation — 2026-06-28.csv
  Pass threshold: std ≤ 4.0 mV  (16 counts = 2 mV minimum step)
==========================================================
  adc0 − adc1   : mean=-0.055 mV  std=1.005 mV  [PASS]
  adc0 − adc2   : mean=+0.913 mV  std=1.146 mV  [PASS]
==========================================================
  >> CALIBRATION OK

Per-Day Calibration Summary

Pass/fail snapshot for every logged day (May 26 → Jun 28). Heat-test window excluded from May 27.

Code
W = 58  # box width

all_csvs = [f for f in sorted(glob.glob(os.path.join(LOGS_DIR, "????-??-??.csv")))
            if "2026-05-26.csv" <= os.path.basename(f) <= "2026-06-28.csv"]

for path in all_csvs:
    fname = os.path.basename(path)
    d = pd.read_csv(path, parse_dates=['timestamp'])
    d = d.sort_values('timestamp').reset_index(drop=True)

    # Exclude heat test window from May 27
    if '2026-05-27' in fname:
        d = d[~((d['timestamp'] >= '2026-05-27 09:51:00') &
                (d['timestamp'] <= '2026-05-27 09:58:15'))]

    diff01 = (d['adc0'] - d['adc1']) * ADC_MV
    diff02 = (d['adc0'] - d['adc2']) * ADC_MV

    results = [
        ('adc0 − adc1', diff01.mean(), diff01.std(), diff01.std() <= PASS_STD_THRESHOLD),
        ('adc0 − adc2', diff02.mean(), diff02.std(), diff02.std() <= PASS_STD_THRESHOLD),
    ]
    all_pass = all(r[3] for r in results)

    print('=' * W)
    print(f"  Calibration Confirmation — {fname}")
    print(f"  Pass threshold: std ≤ {PASS_STD_THRESHOLD} mV  (16 counts = 2 mV minimum step)")
    print('=' * W)
    for label, mean_v, std_v, passed in results:
        print(f"  {label:12s}: mean={mean_v:+.3f} mV  std={std_v:.3f} mV  [{'PASS' if passed else 'FAIL'}]")
    print('=' * W)
    print(f"  >> {'CALIBRATION OK' if all_pass else 'CALIBRATION FAIL'}")
    print('=' * W)
    print()
==========================================================
  Calibration Confirmation — 2026-05-26.csv
  Pass threshold: std ≤ 4.0 mV  (16 counts = 2 mV minimum step)
==========================================================
  adc0 − adc1 : mean=+0.854 mV  std=9.612 mV  [FAIL]
  adc0 − adc2 : mean=-4.275 mV  std=5.422 mV  [FAIL]
==========================================================
  >> CALIBRATION FAIL
==========================================================

==========================================================
  Calibration Confirmation — 2026-05-27.csv
  Pass threshold: std ≤ 4.0 mV  (16 counts = 2 mV minimum step)
==========================================================
  adc0 − adc1 : mean=+10.913 mV  std=0.977 mV  [PASS]
  adc0 − adc2 : mean=+0.580 mV  std=2.248 mV  [PASS]
==========================================================
  >> CALIBRATION OK
==========================================================

==========================================================
  Calibration Confirmation — 2026-05-28.csv
  Pass threshold: std ≤ 4.0 mV  (16 counts = 2 mV minimum step)
==========================================================
  adc0 − adc1 : mean=+3.376 mV  std=7.446 mV  [FAIL]
  adc0 − adc2 : mean=-1.346 mV  std=3.690 mV  [PASS]
==========================================================
  >> CALIBRATION FAIL
==========================================================

==========================================================
  Calibration Confirmation — 2026-05-29.csv
  Pass threshold: std ≤ 4.0 mV  (16 counts = 2 mV minimum step)
==========================================================
  adc0 − adc1 : mean=+0.153 mV  std=1.474 mV  [PASS]
  adc0 − adc2 : mean=-0.750 mV  std=1.327 mV  [PASS]
==========================================================
  >> CALIBRATION OK
==========================================================

==========================================================
  Calibration Confirmation — 2026-05-30.csv
  Pass threshold: std ≤ 4.0 mV  (16 counts = 2 mV minimum step)
==========================================================
  adc0 − adc1 : mean=+1.450 mV  std=0.969 mV  [PASS]
  adc0 − adc2 : mean=+0.082 mV  std=0.880 mV  [PASS]
==========================================================
  >> CALIBRATION OK
==========================================================

==========================================================
  Calibration Confirmation — 2026-05-31.csv
  Pass threshold: std ≤ 4.0 mV  (16 counts = 2 mV minimum step)
==========================================================
  adc0 − adc1 : mean=+0.733 mV  std=1.000 mV  [PASS]
  adc0 − adc2 : mean=-0.086 mV  std=1.139 mV  [PASS]
==========================================================
  >> CALIBRATION OK
==========================================================

==========================================================
  Calibration Confirmation — 2026-06-01.csv
  Pass threshold: std ≤ 4.0 mV  (16 counts = 2 mV minimum step)
==========================================================
  adc0 − adc1 : mean=+0.383 mV  std=0.811 mV  [PASS]
  adc0 − adc2 : mean=-0.396 mV  std=1.056 mV  [PASS]
==========================================================
  >> CALIBRATION OK
==========================================================

==========================================================
  Calibration Confirmation — 2026-06-02.csv
  Pass threshold: std ≤ 4.0 mV  (16 counts = 2 mV minimum step)
==========================================================
  adc0 − adc1 : mean=+0.303 mV  std=1.894 mV  [PASS]
  adc0 − adc2 : mean=-0.297 mV  std=3.592 mV  [PASS]
==========================================================
  >> CALIBRATION OK
==========================================================

==========================================================
  Calibration Confirmation — 2026-06-03.csv
  Pass threshold: std ≤ 4.0 mV  (16 counts = 2 mV minimum step)
==========================================================
  adc0 − adc1 : mean=+0.435 mV  std=0.855 mV  [PASS]
  adc0 − adc2 : mean=+1.439 mV  std=1.219 mV  [PASS]
==========================================================
  >> CALIBRATION OK
==========================================================

==========================================================
  Calibration Confirmation — 2026-06-04.csv
  Pass threshold: std ≤ 4.0 mV  (16 counts = 2 mV minimum step)
==========================================================
  adc0 − adc1 : mean=+0.852 mV  std=1.033 mV  [PASS]
  adc0 − adc2 : mean=+1.691 mV  std=1.402 mV  [PASS]
==========================================================
  >> CALIBRATION OK
==========================================================

==========================================================
  Calibration Confirmation — 2026-06-05.csv
  Pass threshold: std ≤ 4.0 mV  (16 counts = 2 mV minimum step)
==========================================================
  adc0 − adc1 : mean=+1.308 mV  std=1.029 mV  [PASS]
  adc0 − adc2 : mean=+1.957 mV  std=1.148 mV  [PASS]
==========================================================
  >> CALIBRATION OK
==========================================================

==========================================================
  Calibration Confirmation — 2026-06-06.csv
  Pass threshold: std ≤ 4.0 mV  (16 counts = 2 mV minimum step)
==========================================================
  adc0 − adc1 : mean=+0.744 mV  std=1.007 mV  [PASS]
  adc0 − adc2 : mean=+1.748 mV  std=1.066 mV  [PASS]
==========================================================
  >> CALIBRATION OK
==========================================================

==========================================================
  Calibration Confirmation — 2026-06-07.csv
  Pass threshold: std ≤ 4.0 mV  (16 counts = 2 mV minimum step)
==========================================================
  adc0 − adc1 : mean=+0.859 mV  std=1.035 mV  [PASS]
  adc0 − adc2 : mean=+1.705 mV  std=1.279 mV  [PASS]
==========================================================
  >> CALIBRATION OK
==========================================================

==========================================================
  Calibration Confirmation — 2026-06-08.csv
  Pass threshold: std ≤ 4.0 mV  (16 counts = 2 mV minimum step)
==========================================================
  adc0 − adc1 : mean=+0.785 mV  std=1.045 mV  [PASS]
  adc0 − adc2 : mean=+1.675 mV  std=1.206 mV  [PASS]
==========================================================
  >> CALIBRATION OK
==========================================================

==========================================================
  Calibration Confirmation — 2026-06-09.csv
  Pass threshold: std ≤ 4.0 mV  (16 counts = 2 mV minimum step)
==========================================================
  adc0 − adc1 : mean=+0.832 mV  std=1.070 mV  [PASS]
  adc0 − adc2 : mean=+1.743 mV  std=1.154 mV  [PASS]
==========================================================
  >> CALIBRATION OK
==========================================================

==========================================================
  Calibration Confirmation — 2026-06-10.csv
  Pass threshold: std ≤ 4.0 mV  (16 counts = 2 mV minimum step)
==========================================================
  adc0 − adc1 : mean=+0.929 mV  std=1.051 mV  [PASS]
  adc0 − adc2 : mean=+1.722 mV  std=1.151 mV  [PASS]
==========================================================
  >> CALIBRATION OK
==========================================================

==========================================================
  Calibration Confirmation — 2026-06-11.csv
  Pass threshold: std ≤ 4.0 mV  (16 counts = 2 mV minimum step)
==========================================================
  adc0 − adc1 : mean=+0.736 mV  std=1.004 mV  [PASS]
  adc0 − adc2 : mean=+1.598 mV  std=1.248 mV  [PASS]
==========================================================
  >> CALIBRATION OK
==========================================================

==========================================================
  Calibration Confirmation — 2026-06-12.csv
  Pass threshold: std ≤ 4.0 mV  (16 counts = 2 mV minimum step)
==========================================================
  adc0 − adc1 : mean=+0.998 mV  std=1.093 mV  [PASS]
  adc0 − adc2 : mean=+1.762 mV  std=1.223 mV  [PASS]
==========================================================
  >> CALIBRATION OK
==========================================================

==========================================================
  Calibration Confirmation — 2026-06-13.csv
  Pass threshold: std ≤ 4.0 mV  (16 counts = 2 mV minimum step)
==========================================================
  adc0 − adc1 : mean=+0.469 mV  std=0.881 mV  [PASS]
  adc0 − adc2 : mean=+1.557 mV  std=1.162 mV  [PASS]
==========================================================
  >> CALIBRATION OK
==========================================================

==========================================================
  Calibration Confirmation — 2026-06-14.csv
  Pass threshold: std ≤ 4.0 mV  (16 counts = 2 mV minimum step)
==========================================================
  adc0 − adc1 : mean=+0.847 mV  std=1.073 mV  [PASS]
  adc0 − adc2 : mean=+1.766 mV  std=1.074 mV  [PASS]
==========================================================
  >> CALIBRATION OK
==========================================================

==========================================================
  Calibration Confirmation — 2026-06-15.csv
  Pass threshold: std ≤ 4.0 mV  (16 counts = 2 mV minimum step)
==========================================================
  adc0 − adc1 : mean=+0.961 mV  std=1.048 mV  [PASS]
  adc0 − adc2 : mean=+0.792 mV  std=1.543 mV  [PASS]
==========================================================
  >> CALIBRATION OK
==========================================================

==========================================================
  Calibration Confirmation — 2026-06-16.csv
  Pass threshold: std ≤ 4.0 mV  (16 counts = 2 mV minimum step)
==========================================================
  adc0 − adc1 : mean=+1.200 mV  std=1.050 mV  [PASS]
  adc0 − adc2 : mean=-0.230 mV  std=1.181 mV  [PASS]
==========================================================
  >> CALIBRATION OK
==========================================================

==========================================================
  Calibration Confirmation — 2026-06-17.csv
  Pass threshold: std ≤ 4.0 mV  (16 counts = 2 mV minimum step)
==========================================================
  adc0 − adc1 : mean=+0.486 mV  std=0.889 mV  [PASS]
  adc0 − adc2 : mean=-0.425 mV  std=1.115 mV  [PASS]
==========================================================
  >> CALIBRATION OK
==========================================================

==========================================================
  Calibration Confirmation — 2026-06-18.csv
  Pass threshold: std ≤ 4.0 mV  (16 counts = 2 mV minimum step)
==========================================================
  adc0 − adc1 : mean=+1.194 mV  std=1.174 mV  [PASS]
  adc0 − adc2 : mean=-0.182 mV  std=1.133 mV  [PASS]
==========================================================
  >> CALIBRATION OK
==========================================================

==========================================================
  Calibration Confirmation — 2026-06-19.csv
  Pass threshold: std ≤ 4.0 mV  (16 counts = 2 mV minimum step)
==========================================================
  adc0 − adc1 : mean=+1.569 mV  std=1.035 mV  [PASS]
  adc0 − adc2 : mean=-0.058 mV  std=1.056 mV  [PASS]
==========================================================
  >> CALIBRATION OK
==========================================================

==========================================================
  Calibration Confirmation — 2026-06-20.csv
  Pass threshold: std ≤ 4.0 mV  (16 counts = 2 mV minimum step)
==========================================================
  adc0 − adc1 : mean=+1.118 mV  std=1.075 mV  [PASS]
  adc0 − adc2 : mean=-0.160 mV  std=1.054 mV  [PASS]
==========================================================
  >> CALIBRATION OK
==========================================================

==========================================================
  Calibration Confirmation — 2026-06-21.csv
  Pass threshold: std ≤ 4.0 mV  (16 counts = 2 mV minimum step)
==========================================================
  adc0 − adc1 : mean=-0.100 mV  std=1.006 mV  [PASS]
  adc0 − adc2 : mean=+0.017 mV  std=1.114 mV  [PASS]
==========================================================
  >> CALIBRATION OK
==========================================================

==========================================================
  Calibration Confirmation — 2026-06-22.csv
  Pass threshold: std ≤ 4.0 mV  (16 counts = 2 mV minimum step)
==========================================================
  adc0 − adc1 : mean=-0.162 mV  std=0.963 mV  [PASS]
  adc0 − adc2 : mean=+0.229 mV  std=0.867 mV  [PASS]
==========================================================
  >> CALIBRATION OK
==========================================================

==========================================================
  Calibration Confirmation — 2026-06-23.csv
  Pass threshold: std ≤ 4.0 mV  (16 counts = 2 mV minimum step)
==========================================================
  adc0 − adc1 : mean=-0.093 mV  std=0.993 mV  [PASS]
  adc0 − adc2 : mean=+0.291 mV  std=1.005 mV  [PASS]
==========================================================
  >> CALIBRATION OK
==========================================================

==========================================================
  Calibration Confirmation — 2026-06-24.csv
  Pass threshold: std ≤ 4.0 mV  (16 counts = 2 mV minimum step)
==========================================================
  adc0 − adc1 : mean=+0.269 mV  std=1.061 mV  [PASS]
  adc0 − adc2 : mean=+0.504 mV  std=1.015 mV  [PASS]
==========================================================
  >> CALIBRATION OK
==========================================================

==========================================================
  Calibration Confirmation — 2026-06-25.csv
  Pass threshold: std ≤ 4.0 mV  (16 counts = 2 mV minimum step)
==========================================================
  adc0 − adc1 : mean=+0.165 mV  std=1.044 mV  [PASS]
  adc0 − adc2 : mean=+0.585 mV  std=1.077 mV  [PASS]
==========================================================
  >> CALIBRATION OK
==========================================================

==========================================================
  Calibration Confirmation — 2026-06-26.csv
  Pass threshold: std ≤ 4.0 mV  (16 counts = 2 mV minimum step)
==========================================================
  adc0 − adc1 : mean=-0.286 mV  std=0.911 mV  [PASS]
  adc0 − adc2 : mean=+0.414 mV  std=1.101 mV  [PASS]
==========================================================
  >> CALIBRATION OK
==========================================================

==========================================================
  Calibration Confirmation — 2026-06-27.csv
  Pass threshold: std ≤ 4.0 mV  (16 counts = 2 mV minimum step)
==========================================================
  adc0 − adc1 : mean=-0.226 mV  std=0.928 mV  [PASS]
  adc0 − adc2 : mean=+0.590 mV  std=1.083 mV  [PASS]
==========================================================
  >> CALIBRATION OK
==========================================================

==========================================================
  Calibration Confirmation — 2026-06-28.csv
  Pass threshold: std ≤ 4.0 mV  (16 counts = 2 mV minimum step)
==========================================================
  adc0 − adc1 : mean=-0.055 mV  std=1.005 mV  [PASS]
  adc0 − adc2 : mean=+0.913 mV  std=1.146 mV  [PASS]
==========================================================
  >> CALIBRATION OK
==========================================================

Calibration Log

2026-06-15 11:40 MDT — ADC2 Adjustment

Analysis of Jun 12–14 data showed ADC2 reading consistently ~13 counts low (median gap adc0 − adc2 = +16 counts).

mosquitto_pub -h 10.0.10.20 -t moon-temp-001/offset/cmd -m '{"adc":2,"offset":-64}'

ADC2 offset: −80 → −64


2026-06-17 — ADC2 Confirmed

Three-day post-adjustment analysis (Jun 15–17) confirms ADC2 correction. ADC1 (offset +16) had a median gap of +6.8 counts (0.85 mV) — within spec but drifting.


2026-06-18 11:31 MDT — ADC1 Wrong-Direction Adjustment ⚠️

ADC1 was reading low (+6.8 counts below ADC0), but offset was reduced:

mosquitto_pub -h 10.0.10.20 -t moon-temp-001/offset/cmd -m '{"adc":1,"offset":10}'

ADC1 offset: +16 → +10 — this was the wrong direction. Gap widened to +11.3 counts (+1.41 mV) over Jun 18–19.


2026-06-20 22:00 MDT — ADC1 Corrected

mosquitto_pub -h 10.0.10.20 -t moon-temp-001/offset/cmd -m '{"adc":1,"offset":22}'

ADC1 offset: +10 → +22


2026-06-22 — ADC1 Confirmed

Jun 21–22 verification: ADC1 mean gap = −0.20 mV, std = 0.91 mV — PASS.


✓ Calibration Complete — 2026-06-28

All three channels are within specification. Sensors ready for deployment.

Channel Final Offset Status
ADC0 0 (reference)
ADC1 +22 counts (+2.75 mV) PASS
ADC2 −64 counts (−8.00 mV) PASS

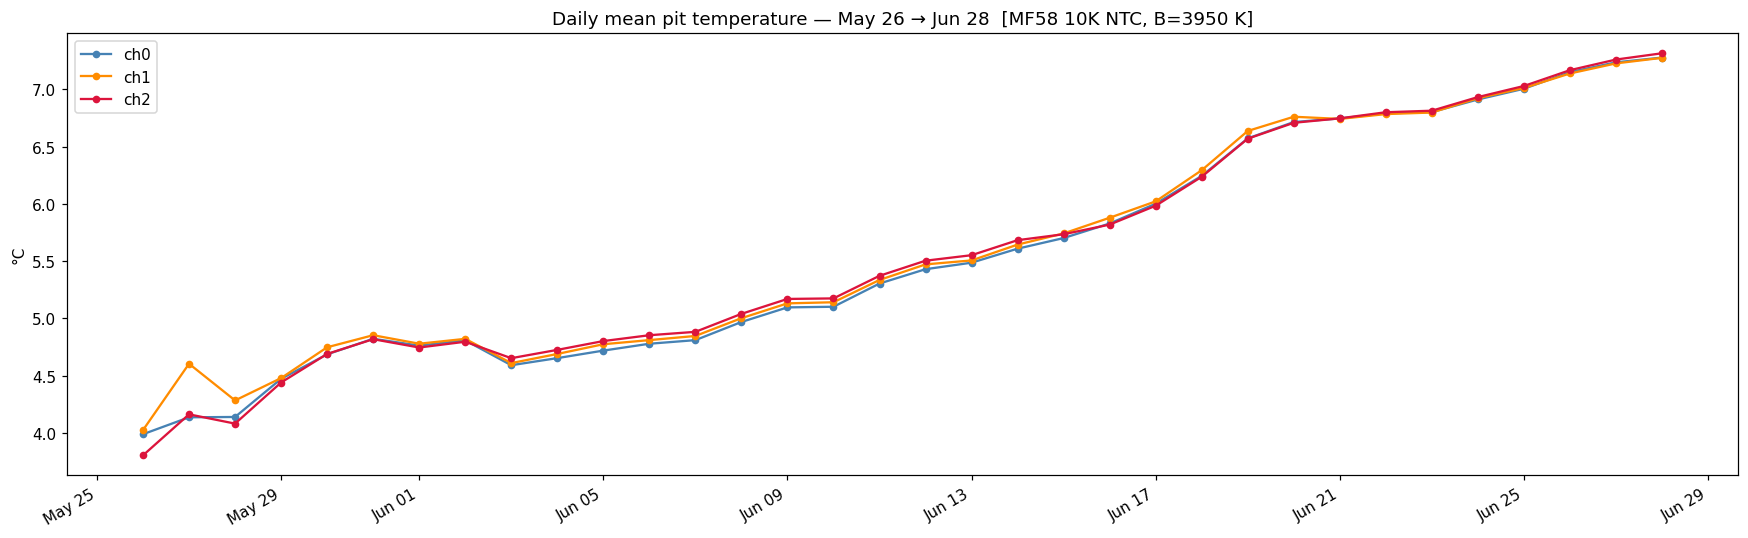
Calibration period: May 26 → June 28, 2026 (33 days) Pass criterion: std(adc0 − adcN) ≤ 4.0 mV Pit temperature drift: +2.1 °C over the calibration period (seasonal ground warming)

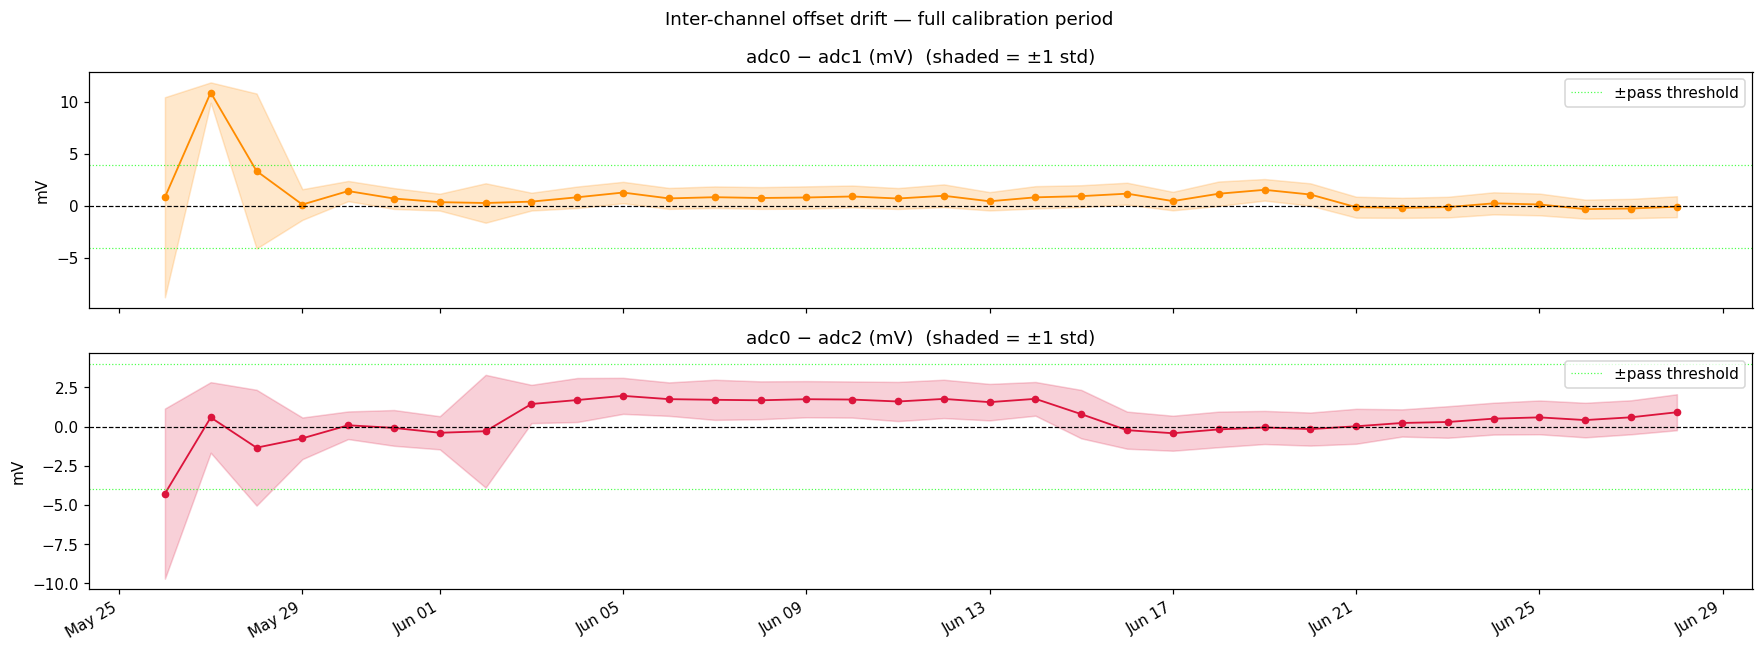
Inter-channel spread stabilised to < 0.05 °C by mid-June. The residual ±5–7 count diurnal swing on ADC1 is a thermal gradient between sensor placements — a DC offset cannot eliminate it, but it is centred around zero.

Next step: Reprogram ESP32-C3 MQTT broker address for field deployment.


Long-Term Stability & Seasonal Warming — May 26 → Jun 28

Loads all 33 days of valid data. Shows the pit temperature rising ~2.1 °C as summer heat diffuses into the ground, and confirms inter-channel offsets held stable throughout.

Code
# Load all valid log days — both 2.3 V era and new v_rail era
R_SERIES = 10_000; R0 = 10_000; B = 3950; T0_K = 298.15
ADC_LSB  = 0.00013108  # calibrated (applies to all channels on this ADS1115)

def counts_to_celsius(counts, v_rail=None):
    """Convert ADS1115 raw count to °C.
    - v_rail present (Jul 2026+): use measured rail voltage
    - v_rail absent (pre-Jul 2026, 2.3 V era): use VCC=2.3
    """
    vcc = v_rail if (v_rail is not None and np.isscalar(v_rail) and v_rail > 0.5) else 2.3
    V   = counts * ADC_LSB
    if V <= 0 or V >= vcc:
        return np.nan
    R = V * R_SERIES / (vcc - V)
    return 1 / (1/T0_K + (1/B) * np.log(R / R0)) - 273.15

# Collect CSVs from both eras
old_csvs = [f for f in sorted(glob.glob(os.path.join(LOGS_2_3V, "????-??-??.csv")))
            if "2026-05-26.csv" <= os.path.basename(f) <= "2026-06-28.csv"]
new_csvs = [f for f in sorted(glob.glob(os.path.join(LOGS_NEW, "????-??-??.csv")))
            if os.path.basename(f) <= "2026-06-28.csv"]
all_csvs = old_csvs + new_csvs

daily = {}
for path in all_csvs:
    date = os.path.basename(path).replace('.csv','')
    d = pd.read_csv(path, parse_dates=['timestamp'])
    d = d.sort_values('timestamp').reset_index(drop=True)
    has_rail = 'v_rail' in d.columns
    for ch in ['adc0','adc1','adc2']:
        col = ch.replace('adc','temp')
        if has_rail:
            d[col] = d.apply(lambda r, c=ch: counts_to_celsius(r[c], r['v_rail']), axis=1)
        else:
            d[col] = d[ch].apply(counts_to_celsius)  # falls back to VCC=2.3
    if date == '2026-05-27':
        d = d[~((d['timestamp'] >= '2026-05-27 09:51:00') & (d['timestamp'] <= '2026-05-27 09:58:15'))]
    daily[date] = d

rows = []
for date, d in daily.items():
    rows.append({
        'date':    pd.Timestamp(date),
        't0':      d['temp0'].mean(),
        't1':      d['temp1'].mean(),
        't2':      d['temp2'].mean(),
        'd01':     (d['adc0'] - d['adc1']).mean() * ADC_MV,
        'd02':     (d['adc0'] - d['adc2']).mean() * ADC_MV,
        'd01_std': (d['adc0'] - d['adc1']).std()  * ADC_MV,
        'd02_std': (d['adc0'] - d['adc2']).std()  * ADC_MV,
        'era':     'v_rail' if 'v_rail' in d.columns else '2.3V',
    })
prog = pd.DataFrame(rows).set_index('date')
print(f"Loaded {len(prog)} days: {prog.index[0].date()}{prog.index[-1].date()}")
print(f"  2.3V era : {(prog['era']=='2.3V').sum()} days")
print(f"  v_rail era: {(prog['era']=='v_rail').sum()} days")
print(prog[['t0','t1','t2','d01','d02','era']].round(3).to_string())
Loaded 34 days: 2026-05-26 → 2026-06-28
  2.3V era : 34 days
  v_rail era: 0 days
               t0     t1     t2     d01    d02   era
date                                                
2026-05-26  3.989  4.025  3.804   0.854 -4.275  2.3V
2026-05-27  4.136  4.604  4.162  10.913  0.580  2.3V
2026-05-28  4.139  4.283  4.081   3.376 -1.346  2.3V
2026-05-29  4.472  4.479  4.440   0.153 -0.750  2.3V
2026-05-30  4.686  4.748  4.690   1.450  0.082  2.3V
2026-05-31  4.822  4.853  4.818   0.733 -0.086  2.3V
2026-06-01  4.762  4.779  4.746   0.383 -0.396  2.3V
2026-06-02  4.808  4.821  4.796   0.303 -0.297  2.3V
2026-06-03  4.591  4.610  4.652   0.435  1.439  2.3V
2026-06-04  4.653  4.689  4.725   0.852  1.691  2.3V
2026-06-05  4.719  4.774  4.802   1.308  1.957  2.3V
2026-06-06  4.779  4.810  4.853   0.744  1.748  2.3V
2026-06-07  4.810  4.846  4.882   0.859  1.705  2.3V
2026-06-08  4.968  5.002  5.039   0.785  1.675  2.3V
2026-06-09  5.096  5.131  5.170   0.832  1.743  2.3V
2026-06-10  5.101  5.141  5.174   0.929  1.722  2.3V
2026-06-11  5.304  5.335  5.372   0.736  1.598  2.3V
2026-06-12  5.429  5.471  5.504   0.998  1.762  2.3V
2026-06-13  5.486  5.506  5.552   0.469  1.557  2.3V
2026-06-14  5.609  5.644  5.683   0.847  1.766  2.3V
2026-06-15  5.701  5.742  5.735   0.961  0.792  2.3V
2026-06-16  5.829  5.879  5.819   1.200 -0.230  2.3V
2026-06-17  6.001  6.022  5.984   0.486 -0.425  2.3V
2026-06-18  6.244  6.294  6.237   1.194 -0.182  2.3V
2026-06-19  6.572  6.637  6.569   1.569 -0.058  2.3V
2026-06-20  6.714  6.761  6.708   1.118 -0.160  2.3V
2026-06-21  6.746  6.742  6.747  -0.100  0.017  2.3V
2026-06-22  6.791  6.784  6.800  -0.162  0.229  2.3V
2026-06-23  6.801  6.798  6.813  -0.093  0.291  2.3V
2026-06-24  6.912  6.923  6.932   0.269  0.504  2.3V
2026-06-25  7.005  7.012  7.029   0.165  0.585  2.3V
2026-06-26  7.150  7.139  7.167  -0.286  0.414  2.3V
2026-06-27  7.236  7.227  7.260  -0.226  0.590  2.3V
2026-06-28  7.277  7.275  7.315  -0.055  0.913  2.3V
Code
# Pit temperature trend — daily mean, all 3 channels
fig, ax = plt.subplots(figsize=(16, 5))
for col, color, label in [('t0','steelblue','ch0'), ('t1','darkorange','ch1'), ('t2','crimson','ch2')]:
    ax.plot(prog.index, prog[col], 'o-', color=color, label=label, linewidth=1.5, markersize=4)
ax.xaxis.set_major_formatter(mdates.DateFormatter('%b %d'))
ax.set_ylabel('°C')
ax.set_title('Daily mean pit temperature — May 26 → Jun 28  [MF58 10K NTC, B=3950 K]')
ax.legend()
fig.autofmt_xdate()
plt.tight_layout()
plt.show()

rise = prog['t0'].iloc[-1] - prog['t0'].iloc[0]
days = (prog.index[-1] - prog.index[0]).days
print(f'Total rise: {rise:+.3f} °C over {days} days  ({rise/days*7:.3f} °C/week)')

Total rise: +3.289 °C over 33 days  (0.698 °C/week)
Code
# Inter-channel offset drift — daily mean ± 1 std (mV)
fig, axes = plt.subplots(2, 1, figsize=(16, 6), sharex=True)
for ax, col, std_col, label, color in [
    (axes[0], 'd01', 'd01_std', 'adc0 − adc1 (mV)', 'darkorange'),
    (axes[1], 'd02', 'd02_std', 'adc0 − adc2 (mV)', 'crimson'),
]:
    ax.fill_between(prog.index, prog[col]-prog[std_col], prog[col]+prog[std_col], color=color, alpha=0.2)
    ax.plot(prog.index, prog[col], 'o-', color=color, linewidth=1.2, markersize=4)
    ax.axhline(0, color='black', linestyle='--', linewidth=0.8)
    ax.axhline( PASS_STD_THRESHOLD, color='lime', linestyle=':', linewidth=0.8, alpha=0.7, label='±pass threshold')
    ax.axhline(-PASS_STD_THRESHOLD, color='lime', linestyle=':', linewidth=0.8, alpha=0.7)
    ax.xaxis.set_major_formatter(mdates.DateFormatter('%b %d'))
    ax.set_ylabel('mV')
    ax.set_title(f'{label}  (shaded = ±1 std)')
    ax.legend(loc='upper right')
fig.suptitle('Inter-channel offset drift — full calibration period', fontsize=12)
fig.autofmt_xdate()
plt.tight_layout()
plt.show()


Updated Equipment Calibration — July 2026

Hardware updated July 2026: variable regulator + dedicated buck converter for ADS1115 VDD, rail voltage monitor on AIN3. Sensors returned to the static thermal chamber for post-update calibration verification.

Current device state (flash config):

{"offset_adc0":0,"offset_adc1":49,"offset_adc2":-73,"avg_samples":64}

Averaging time: 4 channels × 64 samples × 9 ms = 2,304 ms ≈ 2.3 seconds per published reading

Offset history: | Applied | ADC1 | ADC2 | Notes | |—|—|—|—| | Jul 11 (initial) | +22 | −64 | Post-hardware-update starting point | | Jul 13 ~10:30 MDT | +49 | −73 | Corrected from 33-day calibration analysis |

Hardware change notes: - Single ADC sample per minute (pre-averaging firmware) produced noise spikes of ±1–2 °C — not actual temperature events; seen during field experimental runs - 64-sample averaging per publish implemented in firmware to suppress these spikes - Rail voltage (AIN3) averaged identically; v_rail tracks ADS1115 VDD

Code
# Load all converted_logs CSVs (post-update calibration era)
field_csvs = sorted(glob.glob(os.path.join(LOGS_CONV, "????-??-??.csv")))
if not field_csvs:
    raise FileNotFoundError(f"No CSVs found in {LOGS_CONV}")

dfs = []
for path in field_csvs:
    d = pd.read_csv(path, parse_dates=['timestamp'])
    d = d.sort_values('timestamp').reset_index(drop=True)
    dfs.append(d)
field = pd.concat(dfs, ignore_index=True).sort_values('timestamp').reset_index(drop=True)

field['d01_mV'] = (field['adc0'] - field['adc1']) * ADC_MV
field['d02_mV'] = (field['adc0'] - field['adc2']) * ADC_MV
field['dt01']   = field['t0_c'] - field['t1_c']
field['dt02']   = field['t0_c'] - field['t2_c']
field['date']   = field['timestamp'].dt.date

# Offset changeover: ADC1 +22→+49, ADC2 -64→-73 applied 2026-07-13 ~10:30 MDT
OFFSET_CUTOVER = pd.Timestamp('2026-07-13 11:00:00')
field_old = field[field['timestamp'] <  OFFSET_CUTOVER].copy()  # old offsets
field_new = field[field['timestamp'] >= OFFSET_CUTOVER].copy()  # new offsets

print(f"Full span  : {field['timestamp'].iloc[0]}{field['timestamp'].iloc[-1]}  ({len(field)} rows)")
print(f"Old offsets: {len(field_old)} rows  (ADC1=+22  ADC2=−64)")
print(f"New offsets: {len(field_new)} rows  (ADC1=+49  ADC2=−73)")
print(f"v_rail     : mean={field['v_rail'].mean():.4f} V  std={field['v_rail'].std():.4f} V")
Full span  : 2026-07-11 10:00:33 → 2026-07-31 19:08:02  (53395 rows)
Old offsets: 2948 rows  (ADC1=+22  ADC2=−64)
New offsets: 50447 rows  (ADC1=+49  ADC2=−73)
v_rail     : mean=3.5178 V  std=0.0309 V

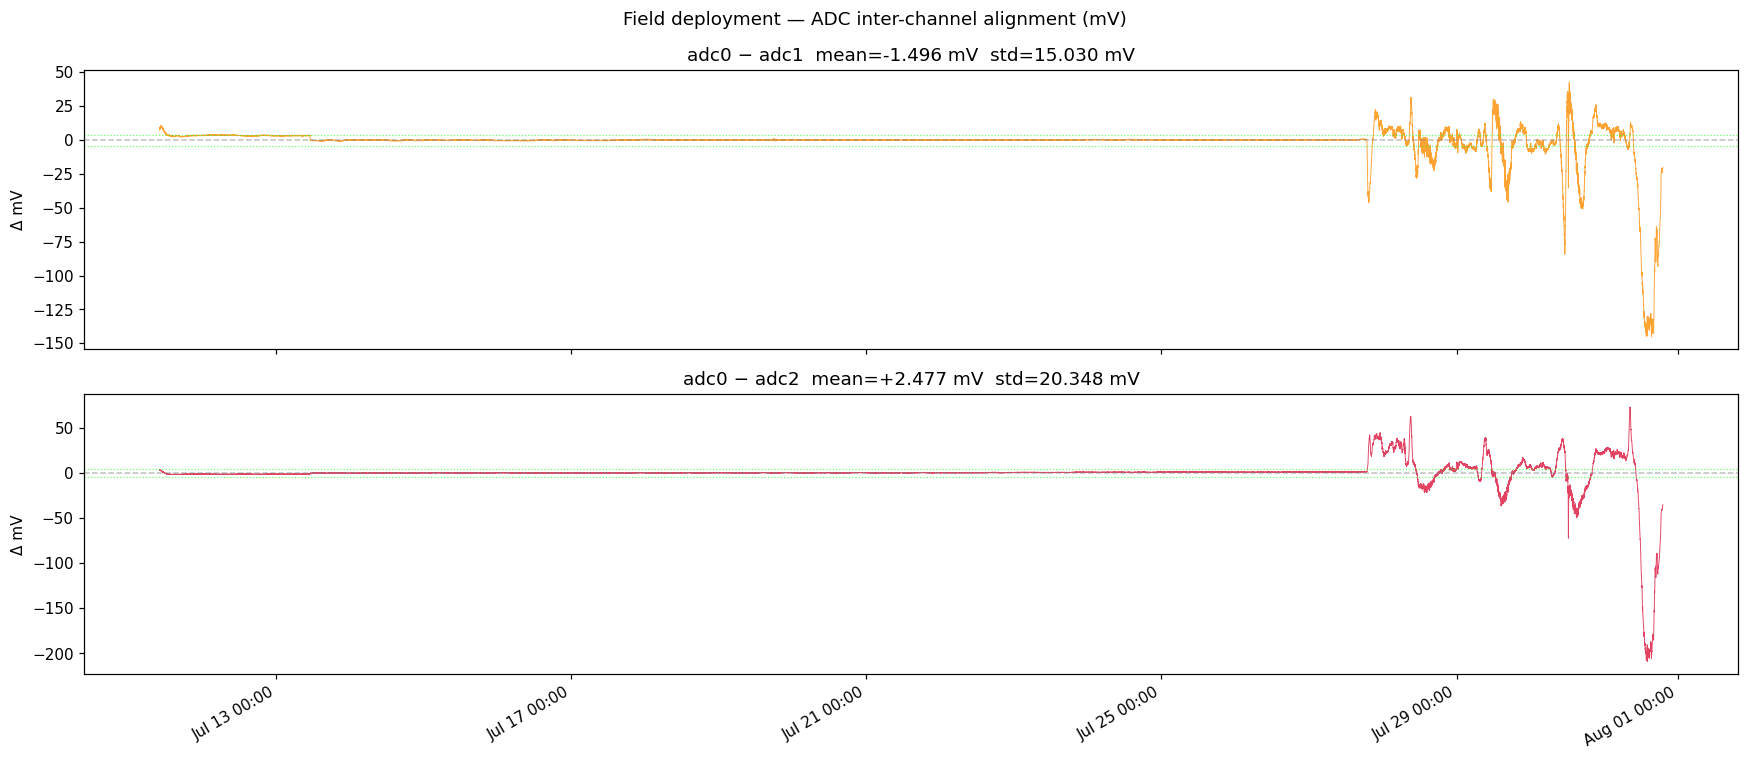
ADC Channel Alignment

Code
# Time series — inter-channel difference in mV
fig, axes = plt.subplots(2, 1, figsize=(16, 7), sharex=True)
for ax, col, label, color in [
    (axes[0], 'd01_mV', 'adc0 − adc1', 'darkorange'),
    (axes[1], 'd02_mV', 'adc0 − adc2', 'crimson'),
]:
    ax.plot(field['timestamp'], field[col], color=color, linewidth=0.6, alpha=0.8)
    ax.axhline(0, color='gray', linestyle='--', linewidth=1, alpha=0.5)
    ax.axhline( PASS_STD_THRESHOLD, color='lime', linestyle=':', linewidth=0.8, alpha=0.6)
    ax.axhline(-PASS_STD_THRESHOLD, color='lime', linestyle=':', linewidth=0.8, alpha=0.6)
    ax.xaxis.set_major_formatter(mdates.DateFormatter('%b %d %H:%M'))
    ax.set_title(f'{label}  mean={field[col].mean():+.3f} mV  std={field[col].std():.3f} mV')
    ax.set_ylabel('Δ mV')
fig.suptitle('Field deployment — ADC inter-channel alignment (mV)', fontsize=12)
fig.autofmt_xdate()
plt.tight_layout()
plt.show()

Code
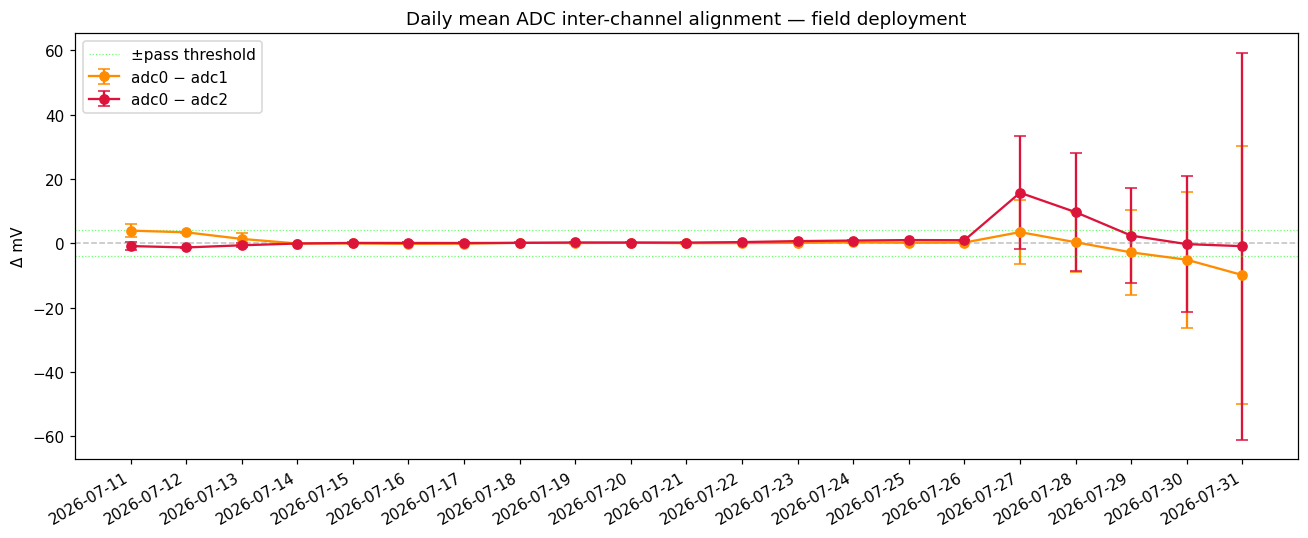
# Daily mean ADC alignment
daily_adc = field.groupby('date').agg(
    d01_mean=('d01_mV', 'mean'), d01_std=('d01_mV', 'std'),
    d02_mean=('d02_mV', 'mean'), d02_std=('d02_mV', 'std'),
).reset_index()

print("Daily ADC alignment (mV):")
print(daily_adc.round(3).to_string(index=False))

fig, ax = plt.subplots(figsize=(12, 5))
x = range(len(daily_adc))
for col_m, col_s, color, lbl in [
    ('d01_mean', 'd01_std', 'darkorange', 'adc0 − adc1'),
    ('d02_mean', 'd02_std', 'crimson',    'adc0 − adc2'),
]:
    ax.errorbar(x, daily_adc[col_m], yerr=daily_adc[col_s], fmt='o-', color=color,
                label=lbl, capsize=4, linewidth=1.5)
ax.axhline(0, color='gray', linestyle='--', linewidth=1, alpha=0.5)
ax.axhline( PASS_STD_THRESHOLD, color='lime', linestyle=':', linewidth=0.8, alpha=0.6, label='±pass threshold')
ax.axhline(-PASS_STD_THRESHOLD, color='lime', linestyle=':', linewidth=0.8, alpha=0.6)
ax.set_xticks(list(x))
ax.set_xticklabels([str(d) for d in daily_adc['date']], rotation=30, ha='right')
ax.set_ylabel('Δ mV')
ax.set_title('Daily mean ADC inter-channel alignment — field deployment')
ax.legend()
plt.tight_layout()
plt.show()
Daily ADC alignment (mV):
      date  d01_mean  d01_std  d02_mean  d02_std
2026-07-11     3.924    1.922    -0.876    1.153
2026-07-12     3.401    0.252    -1.308    0.151
2026-07-13     1.348    1.782    -0.633    0.609
2026-07-14    -0.079    0.212    -0.079    0.174
2026-07-15    -0.056    0.199     0.099    0.180
2026-07-16    -0.184    0.200     0.084    0.171
2026-07-17    -0.114    0.216     0.075    0.164
2026-07-18     0.142    0.181     0.116    0.186
2026-07-19     0.072    0.175     0.237    0.188
2026-07-20     0.146    0.151     0.220    0.174
2026-07-21     0.040    0.120     0.198    0.169
2026-07-22     0.058    0.124     0.359    0.170
2026-07-23     0.131    0.148     0.666    0.162
2026-07-24     0.276    0.137     0.836    0.132
2026-07-25     0.151    0.127     0.988    0.127
2026-07-26     0.218    0.134     0.944    0.160
2026-07-27     3.468    9.873    15.710   17.637
2026-07-28     0.308    9.271     9.668   18.376
2026-07-29    -2.835   13.297     2.365   14.722
2026-07-30    -5.128   21.094    -0.271   21.265
2026-07-31    -9.898   40.104    -0.912   60.225

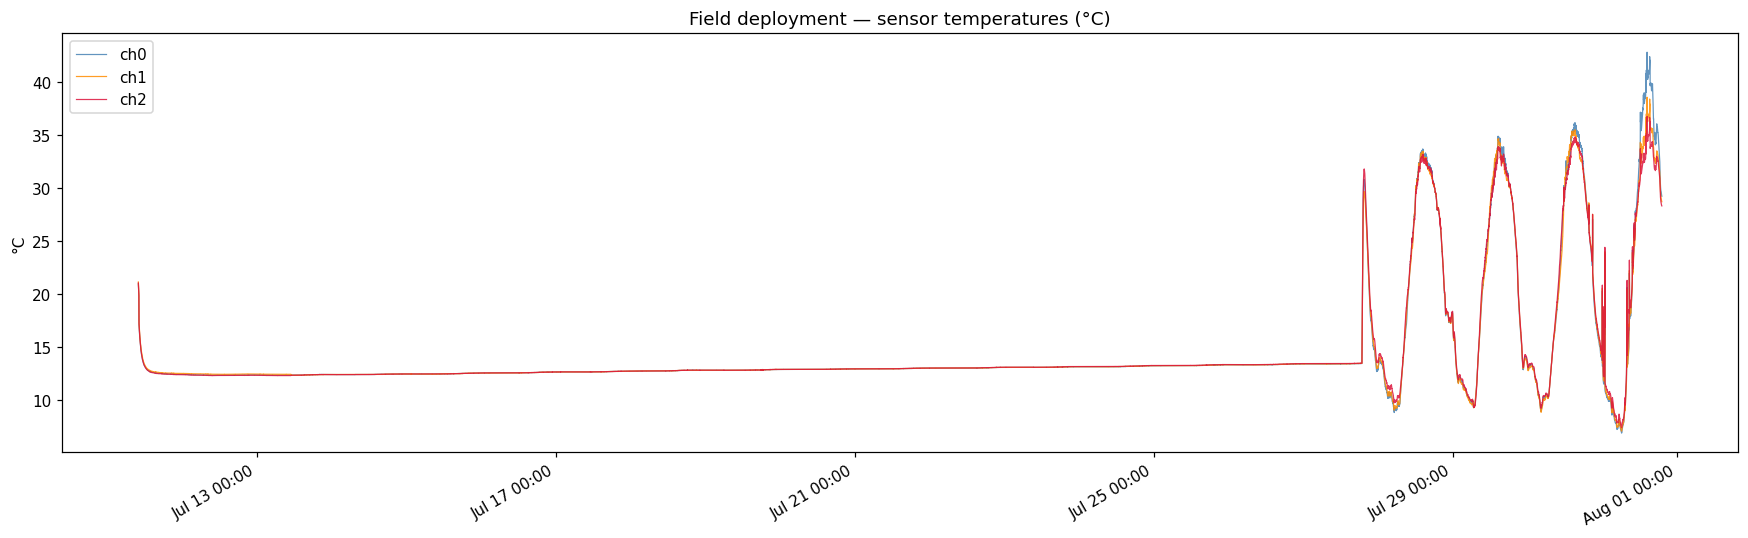
Temperature (°C)

Code
# Full time series in °C
fig, ax = plt.subplots(figsize=(16, 5))
for col, color, label in [
    ('t0_c', 'steelblue',  'ch0'),
    ('t1_c', 'darkorange', 'ch1'),
    ('t2_c', 'crimson',    'ch2'),
]:
    ax.plot(field['timestamp'], field[col], color=color, linewidth=0.8, alpha=0.85, label=label)
ax.xaxis.set_major_formatter(mdates.DateFormatter('%b %d %H:%M'))
ax.set_ylabel('°C')
ax.set_title('Field deployment — sensor temperatures (°C)')
ax.legend()
fig.autofmt_xdate()
plt.tight_layout()
plt.show()

Code
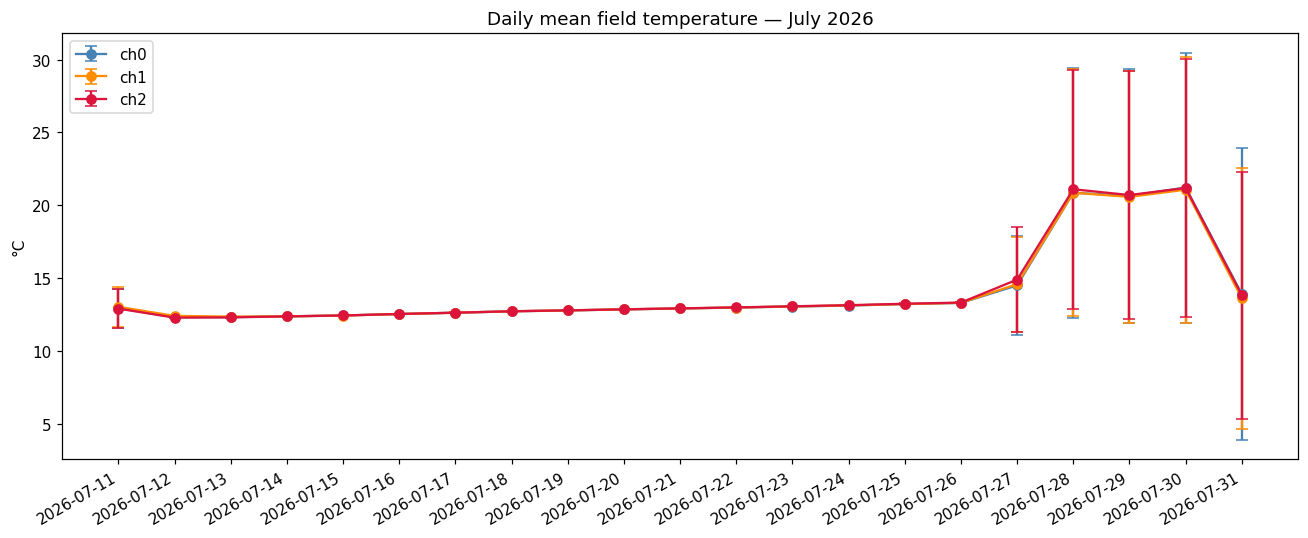
# Daily mean temperature in °C
daily_temp = field.groupby('date').agg(
    t0_mean=('t0_c', 'mean'), t0_std=('t0_c', 'std'),
    t1_mean=('t1_c', 'mean'), t1_std=('t1_c', 'std'),
    t2_mean=('t2_c', 'mean'), t2_std=('t2_c', 'std'),
).reset_index()

print("Daily mean temperature (°C):")
print(daily_temp.round(3).to_string(index=False))

fig, ax = plt.subplots(figsize=(12, 5))
x = range(len(daily_temp))
for col_m, col_s, color, lbl in [
    ('t0_mean', 't0_std', 'steelblue',  'ch0'),
    ('t1_mean', 't1_std', 'darkorange', 'ch1'),
    ('t2_mean', 't2_std', 'crimson',    'ch2'),
]:
    ax.errorbar(x, daily_temp[col_m], yerr=daily_temp[col_s], fmt='o-', color=color,
                label=lbl, capsize=4, linewidth=1.5)
ax.set_xticks(list(x))
ax.set_xticklabels([str(d) for d in daily_temp['date']], rotation=30, ha='right')
ax.set_ylabel('°C')
ax.set_title('Daily mean field temperature — July 2026')
ax.legend()
plt.tight_layout()
plt.show()
Daily mean temperature (°C):
      date  t0_mean  t0_std  t1_mean  t1_std  t2_mean  t2_std
2026-07-11   12.928   1.338   13.027   1.375   12.905   1.364
2026-07-12   12.319   0.020   12.406   0.023   12.286   0.021
2026-07-13   12.319   0.026   12.354   0.037   12.303   0.037
2026-07-14   12.374   0.019   12.372   0.018   12.371   0.022
2026-07-15   12.432   0.034   12.430   0.034   12.434   0.033
2026-07-16   12.534   0.032   12.529   0.035   12.536   0.030
2026-07-17   12.623   0.024   12.620   0.028   12.625   0.025
2026-07-18   12.719   0.034   12.723   0.031   12.722   0.036
2026-07-19   12.779   0.026   12.781   0.028   12.785   0.027
2026-07-20   12.851   0.017   12.855   0.015   12.856   0.019
2026-07-21   12.915   0.025   12.916   0.025   12.920   0.027
2026-07-22   12.978   0.024   12.980   0.024   12.987   0.025
2026-07-23   13.047   0.022   13.051   0.024   13.064   0.025
2026-07-24   13.117   0.033   13.124   0.032   13.138   0.033
2026-07-25   13.214   0.032   13.217   0.033   13.239   0.031
2026-07-26   13.296   0.032   13.302   0.032   13.320   0.034
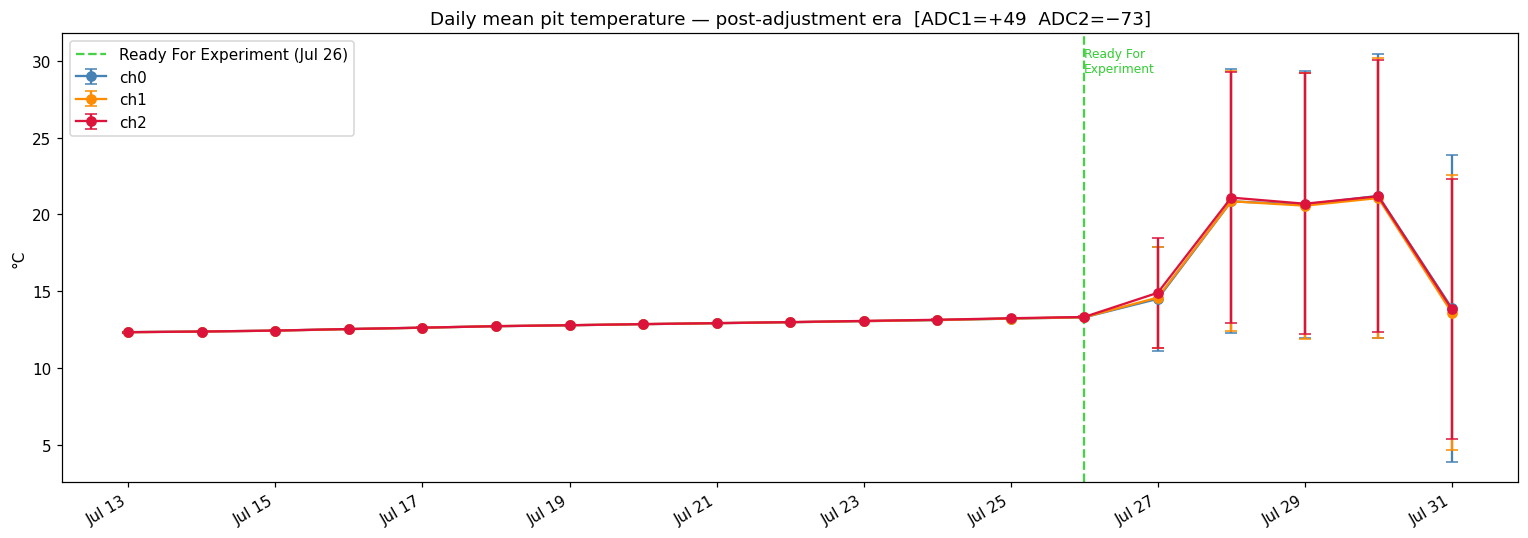
2026-07-27   14.501   3.408   14.586   3.266   14.896   3.580
2026-07-28   20.858   8.603   20.862   8.464   21.100   8.193
2026-07-29   20.651   8.725   20.575   8.675   20.702   8.502
2026-07-30   21.214   9.274   21.073   9.135   21.190   8.876
2026-07-31   13.901  10.006   13.605   8.950   13.833   8.480

Code
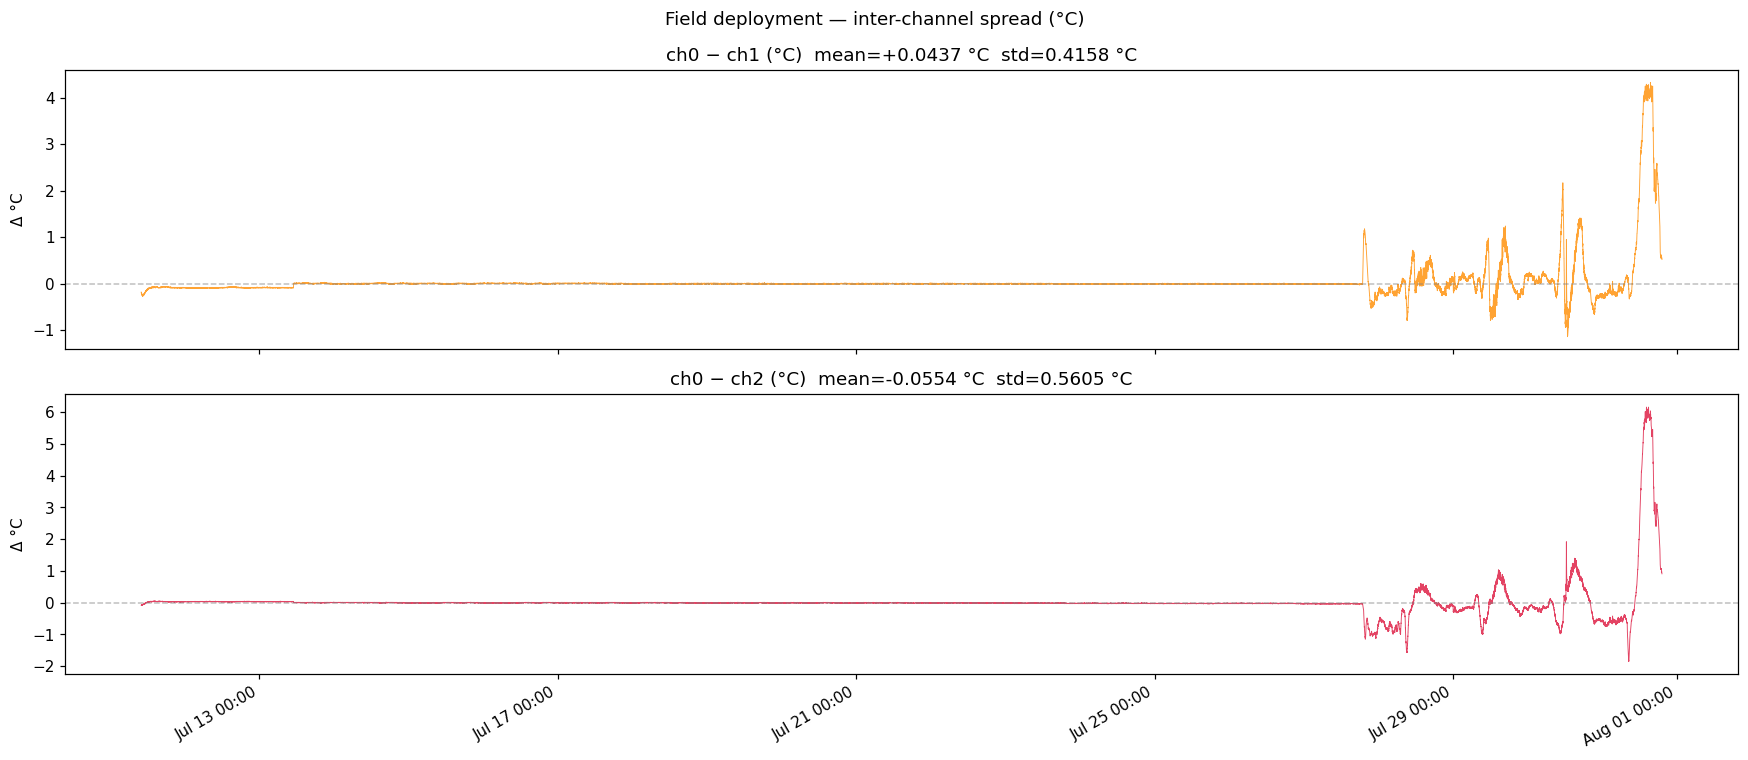
# Inter-channel spread in °C
fig, axes = plt.subplots(2, 1, figsize=(16, 7), sharex=True)
for ax, col, label, color in [
    (axes[0], 'dt01', 'ch0 − ch1 (°C)', 'darkorange'),
    (axes[1], 'dt02', 'ch0 − ch2 (°C)', 'crimson'),
]:
    ax.plot(field['timestamp'], field[col], color=color, linewidth=0.6, alpha=0.8)
    ax.axhline(0, color='gray', linestyle='--', linewidth=1, alpha=0.5)
    ax.xaxis.set_major_formatter(mdates.DateFormatter('%b %d %H:%M'))
    ax.set_title(f'{label}  mean={field[col].mean():+.4f} °C  std={field[col].std():.4f} °C')
    ax.set_ylabel('Δ °C')
fig.suptitle('Field deployment — inter-channel spread (°C)', fontsize=12)
fig.autofmt_xdate()
plt.tight_layout()
plt.show()

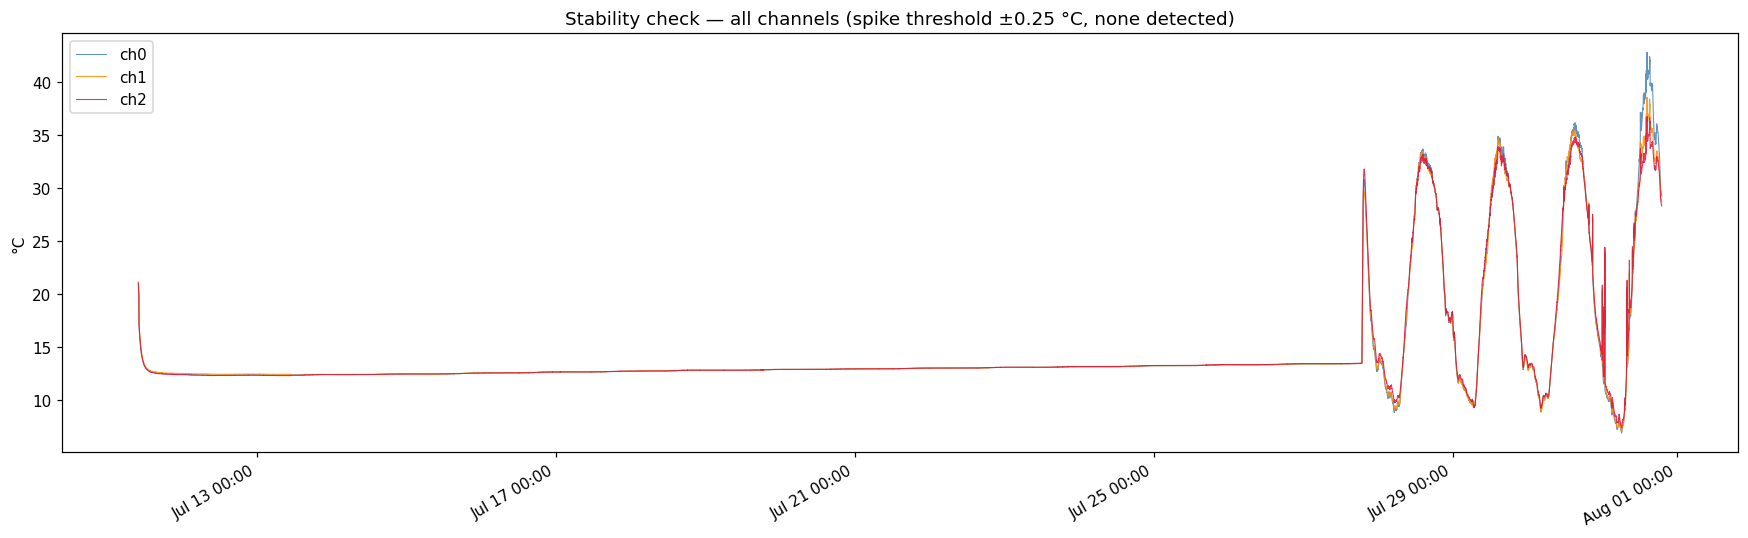
Stability Check — Spike Detection

Sensors sit in a high-thermal-mass concrete pit: temperature should be extremely stable (< 0.05 °C variation per sample under normal conditions). Any sample deviating > 1.5 °C from its 5-sample rolling median is flagged as a suspect read.

Code
# Flag samples that deviate more than 1.5 °C from a 5-point rolling median
SPIKE_THRESH = 0.25  # °C

field_s = field.sort_values('timestamp').reset_index(drop=True)
spike_rows = pd.DataFrame()
for ch in ['t0_c', 't1_c', 't2_c']:
    roll = field_s[ch].rolling(5, center=True, min_periods=1).median()
    mask = (field_s[ch] - roll).abs() > SPIKE_THRESH
    if mask.any():
        bad = field_s[mask][['timestamp', 'adc0', 'adc1', 'adc2', 'v_rail', ch]].copy()
        bad['channel'] = ch
        bad['deviation_C'] = (field_s[ch] - roll)[mask]
        spike_rows = pd.concat([spike_rows, bad])

if spike_rows.empty:
    print(f"No spikes detected (threshold: >{SPIKE_THRESH} °C from 5-sample rolling median)")
    print("Signal is stable — consistent with high-thermal-mass static chamber environment.")
else:
    print(f"{len(spike_rows)} suspect samples found:")
    print(spike_rows[['timestamp','channel','deviation_C']].to_string(index=False))

# Plot all channels with spike threshold bands
fig, ax = plt.subplots(figsize=(16, 5))
for col, color, label in [('t0_c','steelblue','ch0'), ('t1_c','darkorange','ch1'), ('t2_c','crimson','ch2')]:
    ax.plot(field_s['timestamp'], field_s[col], color=color, linewidth=0.7, alpha=0.85, label=label)
ax.xaxis.set_major_formatter(mdates.DateFormatter('%b %d %H:%M'))
ax.set_ylabel('°C')
ax.set_title(f'Stability check — all channels (spike threshold ±{SPIKE_THRESH} °C, none detected)')
ax.legend()
fig.autofmt_xdate()
plt.tight_layout()
plt.show()
132 suspect samples found:
          timestamp channel  deviation_C
2026-07-30 11:39:52    t0_c         0.44
2026-07-30 11:40:02    t0_c         0.48
2026-07-30 19:42:32    t0_c         0.95
2026-07-30 20:53:52    t0_c         0.77
2026-07-30 20:54:02    t0_c         2.74
2026-07-31 00:01:52    t0_c         1.01
2026-07-31 00:02:02    t0_c         2.59
2026-07-31 00:09:12    t0_c         0.29
2026-07-31 00:11:32    t0_c        -0.37
2026-07-31 00:12:12    t0_c         0.41
2026-07-31 00:13:52    t0_c         0.79
2026-07-31 00:14:02    t0_c         1.11
2026-07-31 00:14:12    t0_c        -0.35
2026-07-31 00:14:22    t0_c         0.35
2026-07-31 00:44:52    t0_c         0.28
2026-07-31 00:45:22    t0_c         0.27
2026-07-31 00:46:22    t0_c        -0.26
2026-07-31 00:48:12    t0_c         0.35
2026-07-31 00:48:22    t0_c        -0.30
2026-07-31 00:48:42    t0_c         0.30
2026-07-31 00:48:52    t0_c        -0.38
2026-07-31 00:50:52    t0_c         0.28
2026-07-31 00:51:02    t0_c         5.74
2026-07-31 07:18:02    t0_c         0.39
2026-07-31 07:56:02    t0_c         1.50
2026-07-31 07:57:02    t0_c         0.37
2026-07-31 07:58:02    t0_c        -2.09
2026-07-31 07:59:02    t0_c         3.50
2026-07-31 08:43:02    t0_c         2.16
2026-07-31 08:44:02    t0_c         1.24
2026-07-31 08:57:02    t0_c         0.31
2026-07-31 09:41:02    t0_c         1.03
2026-07-31 09:42:02    t0_c         1.42
2026-07-31 09:47:02    t0_c        -0.27
2026-07-31 10:12:02    t0_c         0.27
2026-07-31 10:16:02    t0_c         0.78
2026-07-31 10:21:02    t0_c         0.74
2026-07-31 12:15:02    t0_c         0.94
2026-07-31 13:12:02    t0_c         0.37
2026-07-31 13:13:02    t0_c         0.44
2026-07-31 14:04:02    t0_c        -0.45
2026-07-31 14:10:02    t0_c         0.42
2026-07-31 14:20:02    t0_c         0.28
2026-07-31 14:24:02    t0_c         0.44
2026-07-31 15:14:02    t0_c         0.48
2026-07-30 11:39:52    t1_c         0.46
2026-07-30 11:40:02    t1_c         0.52
2026-07-30 19:42:32    t1_c         0.94
2026-07-30 20:53:52    t1_c         0.76
2026-07-30 20:54:02    t1_c         2.72
2026-07-31 00:01:52    t1_c         0.98
2026-07-31 00:02:02    t1_c         2.59
2026-07-31 00:09:12    t1_c         0.28
2026-07-31 00:11:32    t1_c        -0.37
2026-07-31 00:12:12    t1_c         0.40
2026-07-31 00:13:52    t1_c         0.77
2026-07-31 00:14:02    t1_c         1.11
2026-07-31 00:14:12    t1_c        -0.35
2026-07-31 00:14:22    t1_c         0.35
2026-07-31 00:44:52    t1_c         0.29
2026-07-31 00:45:22    t1_c         0.26
2026-07-31 00:48:12    t1_c         0.35
2026-07-31 00:48:22    t1_c        -0.31
2026-07-31 00:48:42    t1_c         0.28
2026-07-31 00:48:52    t1_c        -0.39
2026-07-31 00:50:52    t1_c         0.27
2026-07-31 00:51:02    t1_c         5.70
2026-07-31 07:18:02    t1_c         0.38
2026-07-31 07:56:02    t1_c         1.50
2026-07-31 07:57:02    t1_c         0.34
2026-07-31 07:58:02    t1_c        -2.10
2026-07-31 07:59:02    t1_c         3.50
2026-07-31 08:43:02    t1_c         2.16
2026-07-31 08:44:02    t1_c         1.25
2026-07-31 08:57:02    t1_c         0.29
2026-07-31 09:41:02    t1_c         1.05
2026-07-31 09:42:02    t1_c         1.46
2026-07-31 09:47:02    t1_c        -0.26
2026-07-31 10:12:02    t1_c         0.28
2026-07-31 10:16:02    t1_c         0.77
2026-07-31 10:21:02    t1_c         0.73
2026-07-31 12:15:02    t1_c         0.90
2026-07-31 13:12:02    t1_c         0.34
2026-07-31 13:13:02    t1_c         0.37
2026-07-31 14:10:02    t1_c         0.44
2026-07-31 14:24:02    t1_c         0.38
2026-07-31 15:14:02    t1_c         0.52
2026-07-30 11:39:52    t2_c         0.45
2026-07-30 11:40:02    t2_c         0.50
2026-07-30 19:42:32    t2_c         0.97
2026-07-30 20:53:52    t2_c         0.78
2026-07-30 20:54:02    t2_c         2.73
2026-07-31 00:01:52    t2_c         1.00
2026-07-31 00:02:02    t2_c         2.59
2026-07-31 00:09:12    t2_c         0.28
2026-07-31 00:11:32    t2_c        -0.36
2026-07-31 00:12:12    t2_c         0.41
2026-07-31 00:13:52    t2_c         0.77
2026-07-31 00:14:02    t2_c         1.10
2026-07-31 00:14:12    t2_c        -0.35
2026-07-31 00:14:22    t2_c         0.35
2026-07-31 00:44:52    t2_c         0.29
2026-07-31 00:45:22    t2_c         0.27
2026-07-31 00:46:22    t2_c        -0.26
2026-07-31 00:48:12    t2_c         0.32
2026-07-31 00:48:22    t2_c        -0.32
2026-07-31 00:48:42    t2_c         0.29
2026-07-31 00:48:52    t2_c        -0.39
2026-07-31 00:50:52    t2_c         0.29
2026-07-31 00:51:02    t2_c         5.70
2026-07-31 07:18:02    t2_c         0.40
2026-07-31 07:56:02    t2_c         1.48
2026-07-31 07:57:02    t2_c         0.38
2026-07-31 07:58:02    t2_c        -2.03
2026-07-31 07:59:02    t2_c         3.50
2026-07-31 08:43:02    t2_c         2.11
2026-07-31 08:44:02    t2_c         1.17
2026-07-31 08:57:02    t2_c         0.31
2026-07-31 09:41:02    t2_c         1.06
2026-07-31 09:42:02    t2_c         1.44
2026-07-31 09:47:02    t2_c        -0.27
2026-07-31 10:12:02    t2_c         0.29
2026-07-31 10:16:02    t2_c         0.77
2026-07-31 10:21:02    t2_c         0.73
2026-07-31 11:53:02    t2_c         0.29
2026-07-31 12:14:02    t2_c         0.28
2026-07-31 12:15:02    t2_c         0.99
2026-07-31 13:12:02    t2_c         0.37
2026-07-31 13:13:02    t2_c         0.39
2026-07-31 14:10:02    t2_c         0.44
2026-07-31 14:24:02    t2_c         0.39
2026-07-31 15:14:02    t2_c         0.53

Offset History & Recommendation

ADC0 is the reference (offset always 0).

Pre-adjustment (Jul 11–12, ADC1=+22, ADC2=−64):

Channel Mean gap (counts) Mean gap (mV) Assessment
ADC1 +26.9 (reads low) +3.52 mV Under-corrected
ADC2 −9.0 (reads high) −1.18 mV Over-corrected

Adjustment applied 2026-07-13: ADC1 +22→+49, ADC2 −64→−73

{"adc":1,"offset":49}
{"adc":2,"offset":-73}
Code
# Offset summary table
rows = [
    ('ADC0', 0,   0.0,   0.0,  0),
    ('ADC1', 22, +26.89, +3.524, 49),
    ('ADC2', -64, -8.97, -1.176, -73),
]
print(f"  {'Ch':5s}  {'Old':>6s}  {'Gap (cts)':>10s}  {'Gap (mV)':>9s}  {'New':>6s}")
for ch, old, gc, gm, new in rows:
    print(f"  {ch:5s}  {old:>+6d}  {gc:>+10.2f}  {gm:>+9.3f}  {new:>+6d}")
  Ch        Old   Gap (cts)   Gap (mV)     New
  ADC0       +0       +0.00     +0.000      +0
  ADC1      +22      +26.89     +3.524     +49
  ADC2      -64       -8.97     -1.176     -73

Post-Adjustment Verification — ADC1=+49, ADC2=−73

Analysis of the new offset era only (2026-07-13 11:00 MDT onwards). Mirrors the 33-day calibration format for direct comparison.

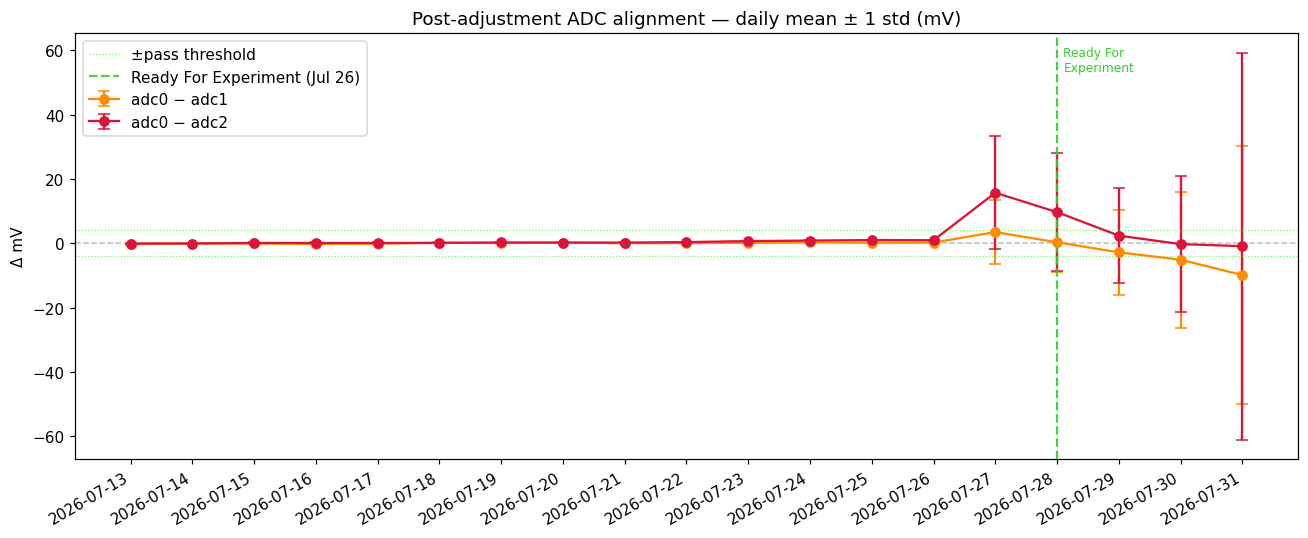
Sensors entered Ready For Experiment mode 2026-07-26 — calibration confirmed stable across all prior days. First night session: Moon-Temp-002 (full moon 99.2%).
Code
# Inter-channel alignment history — post-adjustment era, daily mean ± std
import datetime as _dt
hist_new = field_new.groupby("date").agg(
    d01_mean=("d01_mV", "mean"), d01_std=("d01_mV", "std"),
    d02_mean=("d02_mV", "mean"), d02_std=("d02_mV", "std"),
).reset_index()

print("Post-adjustment inter-channel alignment (mV):")
print(hist_new.round(3).to_string(index=False))

fig, ax = plt.subplots(figsize=(12, 5))
x = range(len(hist_new))
for col_m, col_s, color, lbl in [
    ("d01_mean", "d01_std", "darkorange", "adc0 − adc1"),
    ("d02_mean", "d02_std", "crimson",    "adc0 − adc2"),
]:
    ax.errorbar(x, hist_new[col_m], yerr=hist_new[col_s], fmt="o-", color=color,
                label=lbl, capsize=4, linewidth=1.5)
ax.axhline(0, color="gray", linestyle="--", linewidth=1, alpha=0.5)
ax.axhline( PASS_STD_THRESHOLD, color="lime", linestyle=":", linewidth=0.8, alpha=0.6, label="±pass threshold")
ax.axhline(-PASS_STD_THRESHOLD, color="lime", linestyle=":", linewidth=0.8, alpha=0.6)

_exp_date = _dt.date(2026, 7, 28)
_dates = list(hist_new["date"])
if _exp_date in _dates:
    _xi = _dates.index(_exp_date)
    ax.axvline(_xi, color="limegreen", linestyle="--", linewidth=1.5, alpha=0.9,
               label="Ready For Experiment (Jul 26)")
    ax.text(_xi + 0.1, 0.97, "Ready For\nExperiment", transform=ax.get_xaxis_transform(),
            color="limegreen", fontsize=8, va="top")

ax.set_xticks(list(x))
ax.set_xticklabels([str(d) for d in hist_new["date"]], rotation=30, ha="right")
ax.set_ylabel("Δ mV")
ax.set_title("Post-adjustment ADC alignment — daily mean ± 1 std (mV)")
ax.legend()
plt.tight_layout()
plt.show()
Post-adjustment inter-channel alignment (mV):
      date  d01_mean  d01_std  d02_mean  d02_std
2026-07-13    -0.282    0.218    -0.088    0.157
2026-07-14    -0.079    0.212    -0.079    0.174
2026-07-15    -0.056    0.199     0.099    0.180
2026-07-16    -0.184    0.200     0.084    0.171
2026-07-17    -0.114    0.216     0.075    0.164
2026-07-18     0.142    0.181     0.116    0.186
2026-07-19     0.072    0.175     0.237    0.188
2026-07-20     0.146    0.151     0.220    0.174
2026-07-21     0.040    0.120     0.198    0.169
2026-07-22     0.058    0.124     0.359    0.170
2026-07-23     0.131    0.148     0.666    0.162
2026-07-24     0.276    0.137     0.836    0.132
2026-07-25     0.151    0.127     0.988    0.127
2026-07-26     0.218    0.134     0.944    0.160
2026-07-27     3.468    9.873    15.710   17.637
2026-07-28     0.308    9.271     9.668   18.376
2026-07-29    -2.835   13.297     2.365   14.722
2026-07-30    -5.128   21.094    -0.271   21.265
2026-07-31    -9.898   40.104    -0.912   60.225

Code
# Per-day pass/fail confirmation — post-adjustment era
W = 58
for date, g in field_new.groupby('date'):
    diff01 = g['d01_mV']; diff02 = g['d02_mV']
    results = [
        ('adc0 − adc1', diff01.mean(), diff01.std(), diff01.std() <= PASS_STD_THRESHOLD),
        ('adc0 − adc2', diff02.mean(), diff02.std(), diff02.std() <= PASS_STD_THRESHOLD),
    ]
    all_pass = all(r[3] for r in results)
    print('=' * W)
    print(f"  Calibration Confirmation — {date}")
    print(f"  Pass threshold: std ≤ {PASS_STD_THRESHOLD} mV")
    print('=' * W)
    for label, mean_v, std_v, passed in results:
        print(f"  {label:12s}: mean={mean_v:+.3f} mV  std={std_v:.3f} mV  [{'PASS' if passed else 'FAIL'}]")
    print('=' * W)
    print(f"  >> {'CALIBRATION OK' if all_pass else 'CALIBRATION FAIL'}")
    print('=' * W)
    print()
==========================================================
  Calibration Confirmation — 2026-07-13
  Pass threshold: std ≤ 4.0 mV
==========================================================
  adc0 − adc1 : mean=-0.282 mV  std=0.218 mV  [PASS]
  adc0 − adc2 : mean=-0.088 mV  std=0.157 mV  [PASS]
==========================================================
  >> CALIBRATION OK
==========================================================

==========================================================
  Calibration Confirmation — 2026-07-14
  Pass threshold: std ≤ 4.0 mV
==========================================================
  adc0 − adc1 : mean=-0.079 mV  std=0.212 mV  [PASS]
  adc0 − adc2 : mean=-0.079 mV  std=0.174 mV  [PASS]
==========================================================
  >> CALIBRATION OK
==========================================================

==========================================================
  Calibration Confirmation — 2026-07-15
  Pass threshold: std ≤ 4.0 mV
==========================================================
  adc0 − adc1 : mean=-0.056 mV  std=0.199 mV  [PASS]
  adc0 − adc2 : mean=+0.099 mV  std=0.180 mV  [PASS]
==========================================================
  >> CALIBRATION OK
==========================================================

==========================================================
  Calibration Confirmation — 2026-07-16
  Pass threshold: std ≤ 4.0 mV
==========================================================
  adc0 − adc1 : mean=-0.184 mV  std=0.200 mV  [PASS]
  adc0 − adc2 : mean=+0.084 mV  std=0.171 mV  [PASS]
==========================================================
  >> CALIBRATION OK
==========================================================

==========================================================
  Calibration Confirmation — 2026-07-17
  Pass threshold: std ≤ 4.0 mV
==========================================================
  adc0 − adc1 : mean=-0.114 mV  std=0.216 mV  [PASS]
  adc0 − adc2 : mean=+0.075 mV  std=0.164 mV  [PASS]
==========================================================
  >> CALIBRATION OK
==========================================================

==========================================================
  Calibration Confirmation — 2026-07-18
  Pass threshold: std ≤ 4.0 mV
==========================================================
  adc0 − adc1 : mean=+0.142 mV  std=0.181 mV  [PASS]
  adc0 − adc2 : mean=+0.116 mV  std=0.186 mV  [PASS]
==========================================================
  >> CALIBRATION OK
==========================================================

==========================================================
  Calibration Confirmation — 2026-07-19
  Pass threshold: std ≤ 4.0 mV
==========================================================
  adc0 − adc1 : mean=+0.072 mV  std=0.175 mV  [PASS]
  adc0 − adc2 : mean=+0.237 mV  std=0.188 mV  [PASS]
==========================================================
  >> CALIBRATION OK
==========================================================

==========================================================
  Calibration Confirmation — 2026-07-20
  Pass threshold: std ≤ 4.0 mV
==========================================================
  adc0 − adc1 : mean=+0.146 mV  std=0.151 mV  [PASS]
  adc0 − adc2 : mean=+0.220 mV  std=0.174 mV  [PASS]
==========================================================
  >> CALIBRATION OK
==========================================================

==========================================================
  Calibration Confirmation — 2026-07-21
  Pass threshold: std ≤ 4.0 mV
==========================================================
  adc0 − adc1 : mean=+0.040 mV  std=0.120 mV  [PASS]
  adc0 − adc2 : mean=+0.198 mV  std=0.169 mV  [PASS]
==========================================================
  >> CALIBRATION OK
==========================================================

==========================================================
  Calibration Confirmation — 2026-07-22
  Pass threshold: std ≤ 4.0 mV
==========================================================
  adc0 − adc1 : mean=+0.058 mV  std=0.124 mV  [PASS]
  adc0 − adc2 : mean=+0.359 mV  std=0.170 mV  [PASS]
==========================================================
  >> CALIBRATION OK
==========================================================

==========================================================
  Calibration Confirmation — 2026-07-23
  Pass threshold: std ≤ 4.0 mV
==========================================================
  adc0 − adc1 : mean=+0.131 mV  std=0.148 mV  [PASS]
  adc0 − adc2 : mean=+0.666 mV  std=0.162 mV  [PASS]
==========================================================
  >> CALIBRATION OK
==========================================================

==========================================================
  Calibration Confirmation — 2026-07-24
  Pass threshold: std ≤ 4.0 mV
==========================================================
  adc0 − adc1 : mean=+0.276 mV  std=0.137 mV  [PASS]
  adc0 − adc2 : mean=+0.836 mV  std=0.132 mV  [PASS]
==========================================================
  >> CALIBRATION OK
==========================================================

==========================================================
  Calibration Confirmation — 2026-07-25
  Pass threshold: std ≤ 4.0 mV
==========================================================
  adc0 − adc1 : mean=+0.151 mV  std=0.127 mV  [PASS]
  adc0 − adc2 : mean=+0.988 mV  std=0.127 mV  [PASS]
==========================================================
  >> CALIBRATION OK
==========================================================

==========================================================
  Calibration Confirmation — 2026-07-26
  Pass threshold: std ≤ 4.0 mV
==========================================================
  adc0 − adc1 : mean=+0.218 mV  std=0.134 mV  [PASS]
  adc0 − adc2 : mean=+0.944 mV  std=0.160 mV  [PASS]
==========================================================
  >> CALIBRATION OK
==========================================================

==========================================================
  Calibration Confirmation — 2026-07-27
  Pass threshold: std ≤ 4.0 mV
==========================================================
  adc0 − adc1 : mean=+3.468 mV  std=9.873 mV  [FAIL]
  adc0 − adc2 : mean=+15.710 mV  std=17.637 mV  [FAIL]
==========================================================
  >> CALIBRATION FAIL
==========================================================

==========================================================
  Calibration Confirmation — 2026-07-28
  Pass threshold: std ≤ 4.0 mV
==========================================================
  adc0 − adc1 : mean=+0.308 mV  std=9.271 mV  [FAIL]
  adc0 − adc2 : mean=+9.668 mV  std=18.376 mV  [FAIL]
==========================================================
  >> CALIBRATION FAIL
==========================================================

==========================================================
  Calibration Confirmation — 2026-07-29
  Pass threshold: std ≤ 4.0 mV
==========================================================
  adc0 − adc1 : mean=-2.835 mV  std=13.297 mV  [FAIL]
  adc0 − adc2 : mean=+2.365 mV  std=14.722 mV  [FAIL]
==========================================================
  >> CALIBRATION FAIL
==========================================================

==========================================================
  Calibration Confirmation — 2026-07-30
  Pass threshold: std ≤ 4.0 mV
==========================================================
  adc0 − adc1 : mean=-5.128 mV  std=21.094 mV  [FAIL]
  adc0 − adc2 : mean=-0.271 mV  std=21.265 mV  [FAIL]
==========================================================
  >> CALIBRATION FAIL
==========================================================

==========================================================
  Calibration Confirmation — 2026-07-31
  Pass threshold: std ≤ 4.0 mV
==========================================================
  adc0 − adc1 : mean=-9.898 mV  std=40.104 mV  [FAIL]
  adc0 − adc2 : mean=-0.912 mV  std=60.225 mV  [FAIL]
==========================================================
  >> CALIBRATION FAIL
==========================================================
Code
# Temperature trend — post-adjustment era
daily_t = field_new.groupby("date").agg(
    t0=("t0_c","mean"), t1=("t1_c","mean"), t2=("t2_c","mean"),
    t0s=("t0_c","std"), t1s=("t1_c","std"), t2s=("t2_c","std"),
).reset_index()
daily_t["date"] = pd.to_datetime(daily_t["date"])

fig, ax = plt.subplots(figsize=(14, 5))
for col, col_s, color, label in [
    ("t0","t0s","steelblue","ch0"), ("t1","t1s","darkorange","ch1"), ("t2","t2s","crimson","ch2")
]:
    ax.errorbar(daily_t["date"], daily_t[col], yerr=daily_t[col_s],
                fmt="o-", color=color, label=label, capsize=4, linewidth=1.5)

_exp_ts = pd.Timestamp("2026-07-26")
ax.axvline(_exp_ts, color="limegreen", linestyle="--", linewidth=1.5, alpha=0.9,
           label="Ready For Experiment (Jul 26)")
ax.text(_exp_ts, 0.97, "Ready For\nExperiment", transform=ax.get_xaxis_transform(),
        color="limegreen", fontsize=8, va="top")

ax.xaxis.set_major_formatter(mdates.DateFormatter("%b %d"))
ax.set_ylabel("°C")
ax.set_title("Daily mean pit temperature — post-adjustment era  [ADC1=+49  ADC2=−73]")
ax.legend()
fig.autofmt_xdate()
plt.tight_layout()
plt.show()

for col, label in [("t0","ch0"),("t1","ch1"),("t2","ch2")]:
    d = field_new[col+"_c"] if col+"_c" in field_new.columns else field_new[{"t0":"t0_c","t1":"t1_c","t2":"t2_c"}[col]]
    print(f"  {label}: mean={d.mean():.3f}°C  std={d.std():.3f}°C  min={d.min():.3f}°C  max={d.max():.3f}°C")

  ch0: mean=17.088°C  std=7.914°C  min=6.830°C  max=42.790°C
  ch1: mean=17.037°C  std=7.755°C  min=7.010°C  max=38.540°C
  ch2: mean=17.149°C  std=7.620°C  min=7.340°C  max=36.720°C
Code
# Inter-channel spread in °C — post-adjustment era
_exp_ts = pd.Timestamp("2026-07-26")
fig, axes = plt.subplots(2, 1, figsize=(16, 7), sharex=True)
for i, (ax, col, label, color) in enumerate([
    (axes[0], "dt01", "ch0 − ch1 (°C)", "darkorange"),
    (axes[1], "dt02", "ch0 − ch2 (°C)", "crimson"),
]):
    ax.plot(field_new["timestamp"], field_new[col], color=color, linewidth=0.6, alpha=0.8)
    ax.axhline(0, color="gray", linestyle="--", linewidth=1, alpha=0.5)
    ax.axvline(_exp_ts, color="limegreen", linestyle="--", linewidth=1.5, alpha=0.9,
               label="Ready For Experiment (Jul 26)")
    ax.text(_exp_ts, 0.97, "Ready For\nExperiment" if i == 0 else "",
            transform=ax.get_xaxis_transform(), color="limegreen", fontsize=8, va="top")
    ax.xaxis.set_major_formatter(mdates.DateFormatter("%b %d %H:%M"))
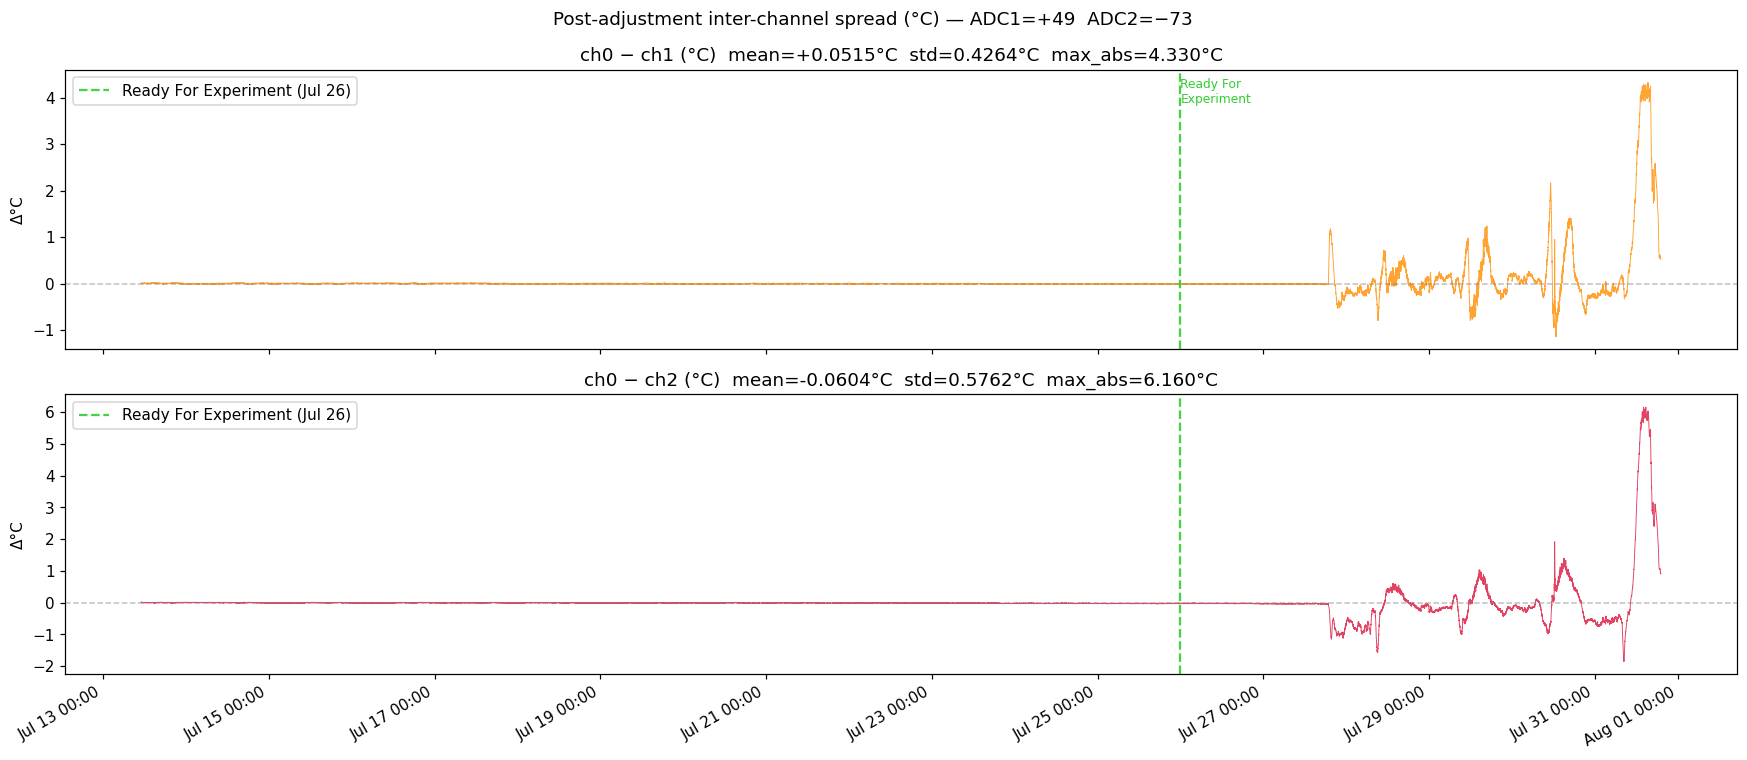
    ax.set_title(f"{label}  mean={field_new[col].mean():+.4f}°C  std={field_new[col].std():.4f}°C  max_abs={field_new[col].abs().max():.3f}°C")
    ax.set_ylabel("Δ°C")
    ax.legend(loc="upper left")
fig.suptitle("Post-adjustment inter-channel spread (°C) — ADC1=+49  ADC2=−73", fontsize=12)
fig.autofmt_xdate()
plt.tight_layout()
plt.show()

Code
# Noise spike analysis — post-adjustment era
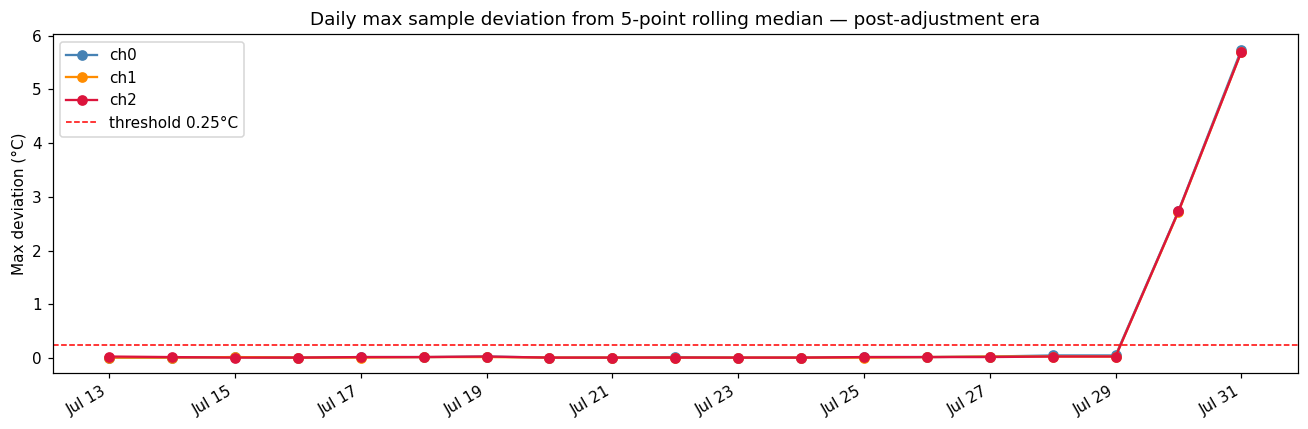
SPIKE_THRESH_NEW = 0.25  # °C

fn = field_new.sort_values('timestamp').reset_index(drop=True)
spike_summary = []
for ch, col in [('ch0','t0_c'), ('ch1','t1_c'), ('ch2','t2_c')]:
    roll = fn[col].rolling(5, center=True, min_periods=1).median()
    dev  = (fn[col] - roll).abs()
    spikes = dev > SPIKE_THRESH_NEW
    spike_summary.append((ch, spikes.sum(), dev.max(), dev.mean()))

print(f"Spike detection threshold: >{SPIKE_THRESH_NEW}°C from 5-sample rolling median")
print("Post-adjustment era:", len(fn), "samples")
all_clear = all(s[1] == 0 for s in spike_summary)
for ch, n, max_dev, mean_dev in spike_summary:
    status = 'CLEAR' if n == 0 else f'{n} SPIKES'
    print(f"  {ch}: max_dev={max_dev:.4f}°C  mean_dev={mean_dev:.4f}°C  [{status}]")

print()
print(f"  >> {'ALL CLEAR — no noise spikes detected' if all_clear else 'SPIKES PRESENT — review above'}")

# Plot max deviation per day
fn['date'] = fn['timestamp'].dt.date
fig, ax = plt.subplots(figsize=(12, 4))
for ch, col, color in [('ch0','t0_c','steelblue'),('ch1','t1_c','darkorange'),('ch2','t2_c','crimson')]:
    roll = fn[col].rolling(5, center=True, min_periods=1).median()
    fn[f'dev_{ch}'] = (fn[col] - roll).abs()
    daily_max = fn.groupby('date')[f'dev_{ch}'].max()
    ax.plot(pd.to_datetime(list(daily_max.index)), daily_max.values, 'o-', color=color, label=ch, linewidth=1.5)
ax.axhline(SPIKE_THRESH_NEW, color='red', linestyle='--', linewidth=1, label=f'threshold {SPIKE_THRESH_NEW}°C')
ax.xaxis.set_major_formatter(mdates.DateFormatter('%b %d'))
ax.set_ylabel('Max deviation (°C)')
ax.set_title('Daily max sample deviation from 5-point rolling median — post-adjustment era')
ax.legend()
fig.autofmt_xdate()
plt.tight_layout()
plt.show()
Spike detection threshold: >0.25°C from 5-sample rolling median
Post-adjustment era: 50447 samples
  ch0: max_dev=5.7400°C  mean_dev=0.0031°C  [45 SPIKES]
  ch1: max_dev=5.7000°C  mean_dev=0.0027°C  [42 SPIKES]
  ch2: max_dev=5.7000°C  mean_dev=0.0027°C  [45 SPIKES]

  >> SPIKES PRESENT — review above